Indonesia's Economy and Development Challenges
Indonesia, a major economy, faces challenges including slowing growth, poverty reduction, income inequality, and carbon emissions. Addressing these conflicting issues is crucial for its progress.
Download Presentation

Please find below an Image/Link to download the presentation.
The content on the website is provided AS IS for your information and personal use only. It may not be sold, licensed, or shared on other websites without obtaining consent from the author. If you encounter any issues during the download, it is possible that the publisher has removed the file from their server.
You are allowed to download the files provided on this website for personal or commercial use, subject to the condition that they are used lawfully. All files are the property of their respective owners.
The content on the website is provided AS IS for your information and personal use only. It may not be sold, licensed, or shared on other websites without obtaining consent from the author.
E N D
Presentation Transcript
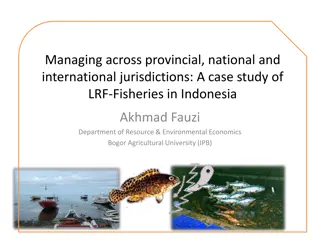
Indonesia's moratorium on palm oil expansion from natural forest: Economy-wide impact and the role of international transfers A.A. Yusuf a, E.L. Roos band J,M Horridge b a) Universitas Padjadjaran, Bandung, Indonesia b)Victoria University, Melbourne, Australia
Indonesia is now among the worlds 10 biggest economies. GDP (PPP$US Trillion) 2013 GDP ($US Trillion) 2013 USA USA 16.77 16.77 CHN CHN 16.16 9.24 IND JPN 6.78 4.92 JPN DEU 4.64 3.73 DEU FRA 3.59 2.81 RUS GBR 3.46 2.68 BRA BRA 3.01 2.25 FRA ITA 2.50 2.15 GBR RUS 2.46 2.10 rank 10 IDN IND 2.39 1.88 ITA CAN 2.13 1.83 MEX AUS 2.01 1.56 KOR ESP 1.66 1.39 SAU KOR 1.55 1.30 ESP MEX 1.54 1.26 rank 16 CAN IDN 1.52 0.87 TUR TUR 1.43 0.82 IRN SAU 1.21 0.75 AUS NGA 1.01 0.52 NGA IRN 0.97 0.37 0 5 10 15 20 0 5 10 15 20 Source: World Bank WDI
which experienced remarkably high growth in the 70s-90s, ... 15 3000 10 2500 5 2000 0 1500 -5 1000 -10 500 -15 0 1962 2008 1960 1964 1966 1968 1970 1972 1974 1976 1978 1980 1982 1984 1986 1988 1990 1992 1994 1996 1998 2000 2002 2004 2006 2010 2012 Growth GDP (Rp Trillion 2005=100) Source: World Bank WDI
and maintained relatively good growth during the global crisis of the 2000s, while many others slowed down. 20 Global crisis 15 10 5 0 2000 2001 2002 2003 2004 2005 2006 2007 2008 2009 2010 2011 2012 2013 -5 -10 EAsiaPacific Indonesia Japan Korea OECD Singapore Thailand World Source: World Bank WDI
Yet, Indonesia is still in the group of lower- middle-income, but with aspiration to escape from the middle income trap very soon. GNI per capita (Atlas Method, US$) 60,000 Indonesia 50,000 China Japan 40,000 Korea Malaysia 30,000 OECD Philippines 20,000 Singapore Thailand 10,000 Vietnam $1,045 0 $4,125 1995 2008 1990 1991 1992 1993 1994 1996 1997 1998 1999 2000 2001 2002 2003 2004 2005 2006 2007 2009 2010 2011 2012 2013
Indonesias recent development challenges 1. A slowing-down in economic growth, .. 2. .. and the rate of poverty reduction 3. Income inequality is rising including no improvement in the inter-regional economic disparity. and .... 4. Global contributor of carbon emissions This paper is a story of where strategies to anticipate the 4 challenges can be conflicting and how to work around it.
The importance of oil palm in national export has been steadily increasing Share of palm oil in national export (%) 10 9 7.73 8 7 6 5 4 3 2 0.97 1 0 1986 1987 1980 1981 1982 1983 1984 1985 1988 1989 1990 1991 1992 1993 1994 1995 1996 1997 1998 1999 2000 2001 2002 2003 2004 2005 2006 2007 2008 2009 2010 Source: FAO database and WDI
In most provinces, palm oil land has doubled in size for the last decade. In Kalimantan (among the most pristine forest), more than tripled. 2,500,000 70 63.3 60 2,000,000 50 40 1,500,000 30 1,000,000 20 14.0 13.7 13.3 10.5 9.0 8.8 8.2 7.3 5.3 10 4.4 4.1 4.1 3.3 1.8 500,000 0 -5.2 0 -10 Riau Lampung Jambi Sulawesi Tengah Kalimantan Tengah Sumatera Barat Sumatera Selatan BaBel Sumatera Utara Kalimantan Timur Papua Aceh Bengkulu Sulawesi Selatan Kalimantan Selatan Banten Kalimantan Barat Sulawesi Tenggara 2000 2012 Annual Growth
If the trend continues, more pressure on natural forest, and more carbon emissions Production and land area of palm oil 300 18 16 250 14 Production (Mtons) 200 12 Area (Mha) 10 150 8 100 6 4 50 2 0 0 1979 2006 1961 1964 1967 1970 1973 1976 1982 1985 1988 1991 1994 1997 2000 2003 2009 2012 2015 2018 2021 2024 Production (MTons) Area (Mha) Poly. (Production (MTons)) Poly. (Area (Mha)) Source: FAO Database
In 2011, Indonesia is the worlds fifth largest GHG emmiter. The world biggest emmitter from Land Use Change and Forestry (LUCF). GHG Emissions, 2011 (MtCO e ) 12,000 10,000 8,000 6,000 4,000 2,000 0 US China Mexico Australia India Brazil Canada Korea Iran Russia Indonesia Japan Germany -2,000 Exluding LUCF LUCF Source: WRI s CAIT Database
Introduction of moratorium In May 2010, GoI announced a moratorium prohibiting district governments from granting new concession licenses for activities that convert of primary forests and peat lands to oil palm plantations (oil palm concessions); to fast- growing tree plantations for pulp and paper (timber concessions) The moratorium was enacted in the context of a national REDD+ strategy of reducing GHG emissions projected to 2020 by 26 41% while increasing gross domestic product by 7% per year, and a $1 billion bilateral cooperative agreement with Norway on reducing emissions from deforestation The moratorium came into force in May 2011 and was extended in May 2013 and May 2017.
Papers objectives This objectives of this paper is (1) to see the macroeconomic effect of the moratorium on the Indonesian economy including how the effect is distributed across different regions in the country and (2) to see to what extent international transfers, which is a payment for ecosystem services (PES) where international community pays the avoided deforestation or the additional carbon storage services can mitigate the effect of the moratorium.
IndoTERM Each region is modeled as a separate economy, prices are different across regions. Recursively run for every year toward 2030 through capital accumulation and other dynamic mechanism Regions are connected through inter-regional trade of commodities and factors is a dynamic inter-regional, bottom-up, computable general equilibrium (CGE) model of Multi markets 175 COM 33 REG 175 IND 9 LAB 1 CAP 1 LND the Indonesian economy Cover the whole national economy, generating standard macroeconomic variables A large system of non- linear equation solved by specialized software (Gempack)
IndoTERM A family of Australian TERM The Enermous Regional Model Developed by CoPS (Centre of Policy Studies), Victoria University (formerly: Monash University) Applied in: Australia, Brazil, Finland, China, South Africa, Indonesia In Indonesia Emerald (Pambudi) IndoTERM v.1 (CEDS UNPAD, CoPS, 2006) IndoTERM v.2 (ADB, CoPS, CEDS UNPAD, 2012) IndoTERM v.3 - Dynamic (CoPS, CEDS UNPAD, BAPPENAS, AusAID, 2013- 2014) A result of years of collaboration among these institutions: CoPS
IndoTERM model specifications (1) Producers in each region are assumed to minimize production costs subject to a nested constant-returns-to-scale (CRS) production technology. In this nested structure, each regional industry s inputs of primary factors are modelled as a constant elasticity of substitution (CES) aggregate of labour, capital and land inputs. Commodity-specific intermediate inputs to each regional industry are modelled as CES composites of foreign and domestic varieties of the commodity. Labour inputs used by each regional industry are distinguished by occupation, with substitution possibilities over occupation-specific labour described via CES functions specific to each regional industry. In each region, the representative households are assumed to choose composite commodities to maximise a Klein-Rubin utility function. Households and firms consume composite commodities that are assumed to be CES aggregations of domestic and imported varieties of each commodity.
IndoTERM model specifications (2) The allocation of investment across regional industries is guided by relative rates of return on capital. For each region-specific industry, new units of physical capital are constructed from domestic/imported composite commodities in a cost-minimising fashion, subject to CRS production technologies. Region-specific export demands for each commodity are modelled via constant elasticity demand schedules which link export volumes from each region to region-specific foreign currency export prices. Regional demands for commodities for public consumption purposes are modelled exogenously, or are linked to regional private consumption.
IndoTERM model specifications (3) The core model includes two dynamic mechanisms, namely, capital accumulation and labour market adjustment. In each region, industry-specific capital is linked to industry-specific investment. Industry-specific investments are linked to changes in industry-specific rates of return. The labour market mechanism guides the labour market from a short-run environment (sticky real wages, flexible labour) to a long-run environment (flexible wage, fix employment). Therefore, in the short run, positive (negative) outcomes are reflected in positive (negative) changes in employment (with no change in real wage) and in the long run reflected as positive (negative) changes in real wage (with employment unchanged).
IndoTERM model specifications (LAND & EMISSIONS) IndoTERM identifies 5 land uses, namely, Crops, Estate Crops, Oil Palm plantation, Managed Forest and Natural Forest. It Specifically model (i) the conversion of natural forest to palm oil plantation and (ii) the REDD payment, which is a once-off payment for the promise of not converting natural forest to palm oil plantations. LNDAREA ( ) i d , = AREA V * xlnd ( ) ( ) i d , i d , 100 = + CO V CO INT * AREA V CO INTNF * NFAREA V 2 2 2 ( ) d ( ) ( ) ( ) d ( ) d i d , i d , i IND = + AREA 0 5 . * AREA f _ rule V V ( ) 1 d ( ) ( ) "Forestry", d " OilPalm d ",
IndoTERM model specifications (LAND & EMISSIONS) REDD t t 1 = REDD V REDD ( ) d ( ) d ( ) d t = + REDD CO PRICE * CO V BaseEmit 2 2 ( ) d ( ) d ( ) d = + BaseEmit CO f _ BaseEmit V ( ) 2 d ( ) d ( ) d = + + + HOUTOT WAGE f _ HOU f _ HOU _ D REDD V ( ) d ( ) d ( ) d ( ) d + GDP BOT NTROW V = SHRBOTGDP
IndoTERM Database INVEST(c,i,d) HOUPUR(c,h,d) purch. value of good c used by household h in d price: phou(c,d) quantity: xhouh_s(c,h,d) structure purch. value of good c used for investment in industry i in d price: pinvest(c,d) quantity: xinvi(c,i,d) Source: USER x DST IND ORG x DST DST Input-Output Table, Inter- regional input-output table, regional data of production, Social Accounting Matrix, FINDEM (HOU,INV, GOV, EXP) quantities: xhou(c,s,d) xinv(c,s,d) xgov(c,s,d) xexp(c,s,d) price: puse(c,s,d) USE_U(c,s,d) = DELIVRD_R(c,s,d) price: pdelivrd_r(c,s,d) quantity: xtrad_r(c,s,d) USE(c,s,u,d) Delivered value: basic + margins (ex-tax) quantity: xint(c,s,i,d) price: puse(c,s,d) DELIVRD (c,s,r,d) = TRADE(c,s,r,d) + sum{m,MAR, TRADMAR(c,s,m,r,d)} COM x SRC = = CES Spatial data price: pdelivrd (c,s,r,d) quantity: xtrad(c,s,r,d) Base year: 2005 + = {Leontief) TRADE (c,s,r,d) good c,s from r to d at basic prices quantity: xtrad(c,s,r,d) price: pbasic(c,s,r) TAX (c,s,u,d) Commodity taxes COM x SRC IMPORT (c,r) + + FACTORS TRADMAR(c,s,m,r,d) margin m on good c,s from r to d quantity: xtradmar(c,s,m,r,d) price: psuppmar_p(m,r,d) MAKE_I(c,r) = TRADE_D (c,"dom",r) LAB(i,o,d) wages CAP(i,d) capital rentals LND(i,d) land rentals PRODTAX(i,d) prod tax = INDUSTRY OUTPUT: VTOT(i,d) = INVENTORIES: STOCKS(i,d) + file data addups sum over COM and SRC Index Set Description c COM Commodities s SRC Domestic or imported (ROW) sources m MAR Margin commodities r ORG Regions of origin d DST Regions of use (destination) p PRD Regions of margin production f FINDEM Final demanders(HOU, INV,GOV, EXP) i IND Industries u USR Users = IND + FINDEM o OCC Skills h HOU Households TRADMAR_CS(m,r,d) = SUPPMAR_P(m,r,d) CES sum over p in REGPRD SUPPMAR(m,r,d,p) Margins supplied by p on goods passing from r to d update: xsuppmar(m,r,d,p)*pdom(m,p) MAKE(c,i,d) MAKE_I (c,d) domestic commodity supplies sum over i in IND output of good c by industry I in d update: xmake(c,i,d)*pmake(c,i,d) COM = MAKE_I(m,p) = SUPPMAR_RD(m,p) + TRADE_D (m,"dom",p) ORG x DST IND x DST DST
Simulation design SIM0 the baseline simulation The absence of the moratorium and REDD scheme. Oil palm land grow between 3- 8 percent per annum depending on the regions toward 2030. Higher growth regions are provinces in Kalimantan and rather low growth regions are in Sumatera. We assume that half the oil palm land is originated from natural forest and the other half from production forest. This is roughly based on Carlson et al (2013). SIM1 Moratorium without international transfers Reproduces the growth paths of (i) but without further conversion of natural forest to palm oil. We assume that oil palm land still grows but from the conversion from managed forest. SIM2 Moratorium with international transfers Reproduces the growth paths of (ii) but with a REDD payment proportional to the emissions saved by (ii). We convert the avoided deforestation into avoided carbon emissions and translate it into international transfers by multiplying the avoided emissions with the price of carbon ($10/tCO2e). We distribute the transfers to the regions according to their magnitude of emissions reduction. The transfers is given directly to representative households who will spend the money received as consumption spending
Palm Oil land area by region (000 ha) (ordinary cumulative deviation from baseline) SIM1 West Sumatra East Sumatra West Kalimantan East Kalimantan Sulawesi Papua 0 2028 2029 2030 2014 2015 2016 2017 2018 2019 2020 2021 2022 2023 2024 2025 2026 2027 -500 DEVIATION FROM BASELINE -1000 -1500 -2000 -2500
GDP from the income side (percentage deviation from baseline) SIM1 0 2026 2014 2015 2016 2017 2018 2019 2020 2021 2022 2023 2024 2025 2027 2028 2029 2030 -0.05 Percentage deviation from baseline -0.1 -0.15 -0.2 -0.25 -0.3 -0.35 Real GDP Employment Capital
Employment by main industry (percentage deviation from baseline) SIM1 2 0 2025 2027 2029 2014 2015 2016 2017 2018 2019 2020 2021 2022 2023 2024 2026 2028 2030 Percentage deviation from baseline -2 -4 -6 -8 -10 -12 Agriculture Mining OilPalm EdibleOil Manufacturing Utilities Services
GDP by region (percentage deviation from baseline) SIM1 0.5 0 2027 2014 2015 2016 2017 2018 2019 2020 2021 2022 2023 2024 2025 2026 2028 2029 2030 Percentage deviation from baseline -0.5 -1 -1.5 -2 -2.5 Sumatra Java Kalimantan Sulawesi BaliNusaTeng PapuaMaluku
REDD payment by region (ordinary change from baseline) SIM2 12000 10000 Ordinary change from baseline 8000 6000 4000 2000 0 2022 2014 2015 2016 2017 2018 2019 2020 2021 2023 2024 2025 2026 2027 2028 2029 2030 West Sumatra East Sumatra West Kalimantan East Kalimantan Sulawesi Papua
GDP, GNE and consumption (percentage deviation from baseline) SIM1 & SIM2 0.300 0.200 Percentage deviation from baseline 0.100 0.000 2014 2015 2016 2017 2018 2019 2020 2021 2022 2023 2024 2025 2026 2027 2028 2029 2030 -0.100 -0.200 -0.300 GDP (Sim1) CONS(Sim1) GNE(Sim1) GDP (Sim2) CONS(Sim2) GNE(Sim2)
However, the impact varies across regions. Kalimantan wins, Sumatera losses. Sumatera is highly-dependent on oil palm, its economy is less broad- based. The carbon stock of its forest is not that high, receive less transfers. Kalimantan is not pretty-much yet dependent on oil plam, the carbon stock of its forest is still high, receive more transfers. Household consumption by provinces in 2030 (% deviation from baseline) 20 15 10 5 0 -5 SulUt Maluku NAD Jambi Banten JaTim SumUt KalBar SulTeng SumSel SulBar BaBel KalTim PapuaBar SulaSel DIY KalSel NTB NTT MalUt PapuaProv Bengkulu Lampung JaTeng SulTra RiauProv JaBar Bali DKI KalTeng Gorontalo KepRi SumBar S1 S2
Conclusion Our simulation suggest that moratorium reduces Indonesian economic growth, and other macroeconomic indicators, but international transfers ($10/tCO2 emissions avoided) can more than compensate the welfare loss. However, the impact varies across regions. Sumatera which is highly-dependent on oil palm; of which its economy is less broad-based and its carbon stock of its forest is no longer high, receive less transfers and suffer a great economic loss. In the meantime, Kalimantan which is relatively less dependent on oil palm than Sumatera, and its forest s carbon stock is still high, receive more transfers and get greater benefit. This result suggest that additional policy measures anticipating the imbalanced impact of the transfers is required if the trade-off between conservation and reducing inter-regional economic disparity needs to be reconciled.

