Inferential Statistics and Probability: Point Estimation & Confidence Intervals
This chapter delves into point estimation and confidence intervals in inferential statistics and probability. Learn about estimating population parameters, conducting hypothesis testing, and constructing confidence intervals. Understand the significance of unbiased point estimators, margin of error, and the interpretation of confidence intervals at different levels.

Download Presentation

Please find below an Image/Link to download the presentation.
The content on the website is provided AS IS for your information and personal use only. It may not be sold, licensed, or shared on other websites without obtaining consent from the author.If you encounter any issues during the download, it is possible that the publisher has removed the file from their server.
You are allowed to download the files provided on this website for personal or commercial use, subject to the condition that they are used lawfully. All files are the property of their respective owners.
The content on the website is provided AS IS for your information and personal use only. It may not be sold, licensed, or shared on other websites without obtaining consent from the author.
E N D
Presentation Transcript
Inferential Statistics and Probability a Holistic Approach Chapter 8 Point Estimation and Confidence Intervals Creative Commons License This Course Material by Maurice Geraghty is licensed under a Creative Commons Attribution-ShareAlike 4.0 International License. Conditions for use are shown here: https://creativecommons.org/licenses/by-sa/4.0/ 1
Inferential Statistics Population Parameters Mean = Proportion = p Standard Deviation = Sample Statistics Mean = Proportion = Standard Deviation = s X p 6
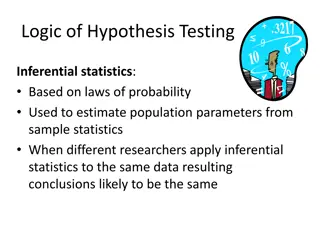
Inferential Statistics Estimation Using sample data to estimate population parameters. Example: Public opinion polls Hypothesis Testing Using sample data to make decisions or claims about population Example: A drug effectively treats a disease 7
Estimation of is an unbiased point estimator of X Example: The number of defective items produced by a machine was recorded for five randomly selected hours during a 40-hour work week. The observed number of defectives were 12, 4, 7, 14, and 10. So the sample mean is 9.4. Thus a point estimate for , the hourly mean number of defectives, is 9.4. 8
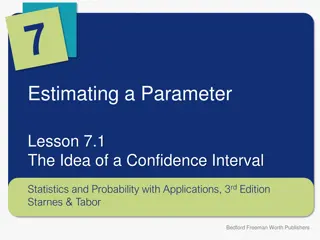
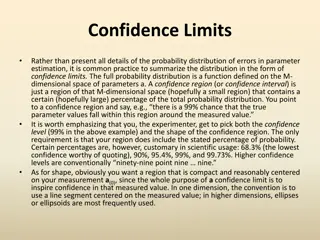
Confidence Intervals An Interval Estimate states the range within which a population parameter probably lies. The interval within which a population parameter is expected to occur is called a Confidence Interval. The distance from the center of the confidence interval to the endpoint is called the Margin of Error The three confidence intervals that are used extensively are the 90%, 95% and 99%. 9
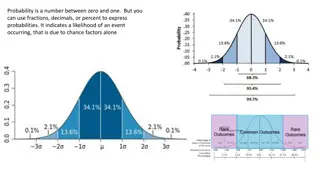
Confidence Intervals A 95% confidence interval means that about 95% of the similarly constructed intervals will contain the parameter being estimated, or 95% of the sample means for a specified sample size will lie within 1.96 standard deviations of the hypothesized population mean. For the 99% confidence interval, 99% of the sample means for a specified sample size will lie within 2.58 standard deviations of the hypothesized population mean. For the 90% confidence interval, 90% of the sample means for a specified sample size will lie within 1.645 standard deviations of the hypothesized population mean. 10
8-18 90%, 95% and 99% Confidence Intervals for The 90%, 95% and 99% confidence intervals for are constructed as follows when n 30 90% CI for the population mean is given by X 645 . 1 n 95% CI for the population mean is given by X 96 . 1 n 99% CI for the population mean is given by 58 . 2 X n 11
8-19 Constructing General Confidence Intervals for In general, a confidence interval for the mean is computed by: X Z n This can also be thought of as: Point Estimator Margin of Error 12
8-19 The nature of Confidence Intervals The Population mean is fixed. The confidence interval is centered around the sample mean which is a Random Variable. So the Confidence Interval (Random Variable) is like a target trying hit a fixed dart ( ). 13
8-20 EXAMPLE The Dean wants to estimate the mean number of hours worked per week by students. A sample of 49 students showed a sample mean of 24 hours with a population standard deviation of 4 hours. The point estimate is 24 hours (sample mean). What is the 95% confidence interval for the average number of hours worked per week by the students? 4 49 24 1.96 = 24 1.12 22.88 25.12 24 14
8-21 EXAMPLE continued To interpret a confidence interval, use the following: We are <confidence level>% confident that <the parameter in context> is between <left endpoint> and <right endpoint> We are 95% confident that the mean hours by students is between 22.88 and 25.12 hours per week. 15
8-20 EXAMPLE What is the 99% confidence interval for the average number of hours worked per week by the students? 4 24 2.576 = 24 1.47 49 22.53 25.47 24 We are 99% confident that the mean hours by students is between 22.53 and 25.47 hours per week. Compare to 95% confidence interval. More confidence means larger margin of error (less precision) 16
8-27 Selecting a Sample Size There are 3 factors that determine the size of a sample, none of which has any direct relationship to the size of the population. They are: The degree of confidence selected. The maximum allowable error. The variation of the population. 17
8-28 Sample Size for the Mean A convenient computational formula for determining n is: = E 2 Z n where E is the allowable error (margin of error), Z is the z score associated with the degree of confidence selected, and is the sample deviation of the pilot survey. can be estimated by past data, target sample or range of data. 18
8-29 EXAMPLE The Dean wants to estimate with 99% confidence the mean number of hours worked per week by students with a margin of error (E) of 0.5 hours. Assume population standard deviation of 4 hours. ( )( ) 2.58 24 426.0096 0.5 = = = 427 n Note: round up to next whole number 19
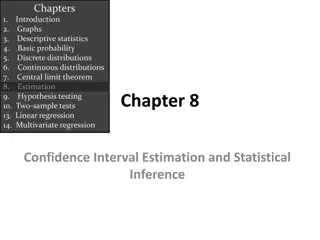
10-3 Characteristics of Student s t- Distribution The t-distribution has the following properties: It is continuous, bell-shaped, and symmetrical about zero like the z-distribution. There is a family of t-distributions sharing a mean of zero but having different standard deviations based on degrees of freedom. The t-distribution is more spread out and flatter at the center than the z-distribution, but approaches the z-distribution as the sample size gets larger. 21
9-3 9-3 The degrees of freedom for the t-distribution isdf = n - 1. z-distribution t-distribution 22
Confidence Interval for ( unknown) Formula to find a confidence interval using the t-distribution for the appropriate level of confidence: s = 1 X t df n n 23
Example Confidence Interval In a random sample of 13 American adults, the mean waste recycled per person per day was 5.3 pounds and the standard deviation was 2.0 pounds. Assume the variable is normally distributed and construct a 95% confidence interval for . 24
Example- Confidence Interval level of confidence = 95% df=13-1=12 t=2.18 0 . 2 3 . 5 . 2 18 13 2 . 1 = 3 . 5 , 1 . 4 ( ) 5 . 6 25
Confidence Intervals, Population Proportions Point estimate for proportion of successes in population is: X p = n X is the number of successes in a sample of size n. ( )( 1 ) p p p Standard deviation of is n Confidence Interval for p: p p (1 ) (1 ) p p p p Z Z n n 26
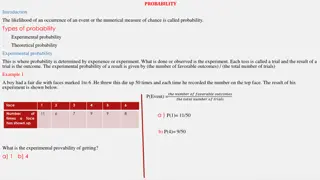
Population Proportion Example In a May 2006 AP/ISPOS Poll, 1000 adults were asked if "Over the next six months, do you expect that increases in the price of gasoline will cause financial hardship for you or your family, or not? 700 of those sampled responded yes! Find the sample proportion and margin of error for this poll. (This means find a 95% confidence interval.) 27
Population Proportion Example Sample proportion 700 = p = = 70 . 70 % 1000 Margin of Error 70 . 1 ( 70 . ) . 1 = = = 96 028 . 8 . 2 % MOE 1000 28
8-28 Sample Size for the Proportion A convenient computational formula for determining n is: ( ( 1 = p n 2 Z ) ) p E where E is the allowable margin of error, Z is the z-score associated with the degree of confidence selected, and p is the population proportion. If p is completely unknown, p can be set equal to which maximizes the value of (p)(1-p) and guarantees the confidence interval will fall within the margin of error. 29
Example In polling, determine the minimum sample size needed to have a margin of error of 3% when p is unknown. . 1 5 . 1 5 . 2 96 ( )( ) = = 1068 n 03 . 31
Example In polling, determine the minimum sample size needed to have a margin of error of 3% when p is known to be close to 1/4. 2 . 1 96 ( )( ) = = 25 . 1 25 . 801 n 03 . 32
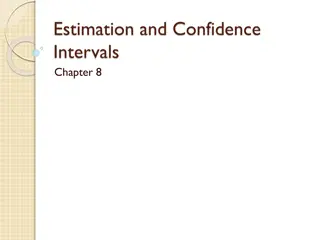
14-2 Characteristics of the Chi-Square Distribution The major characteristics of the chi- square distribution are: It is positively skewed It is non-negative It is based on degrees of freedom When the degrees of freedom change, a new distribution is created 33
2-2 CHI-SQUARE DISTRIBUTION df = 3 df = 5 df = 10 34
Inference about Population Variance and Standard Deviation s2 is an unbiased point estimator for 2 s is a point estimator for Interval estimates and hypothesis testing for both 2 and require a new distribution the 2 (Chi-square) 35
Distribution of s2 n 2 ( ) 1 s has a chi-square distribution 2 n-1 is degrees of freedom s2 is sample variance 2 is population variance 36
Confidence interval for 2 Confidence is NOT symmetric since chi-square distribution is not symmetric. You must find separate left and right bounds. We can construct a confidence interval for 2 ( ) ( 2 , R ) 2 2 1 1 n s n s 2 L Take square root of both endpoints to get confidence interval for the population standard deviation. 37
Example In performance measurement of investments, standard deviation is a measure of volatility or risk. Twenty monthly returns from a mutual fund show an average monthly return of 1% and a sample standard deviation of 5% Find a 95% confidence interval for the monthly standard deviation of the mutual fund. 38
Example (cont) df = n-1 =19 95% CI for ( ) . 32 ( ) 90655 . 8 2 2 19 5 19 5 ( ) 3 . 7 , 8 . 3 = , 8523 39


")


")