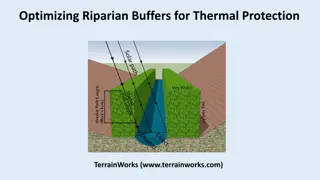
Inferring Thermal Parameters from Infrared Data Stream
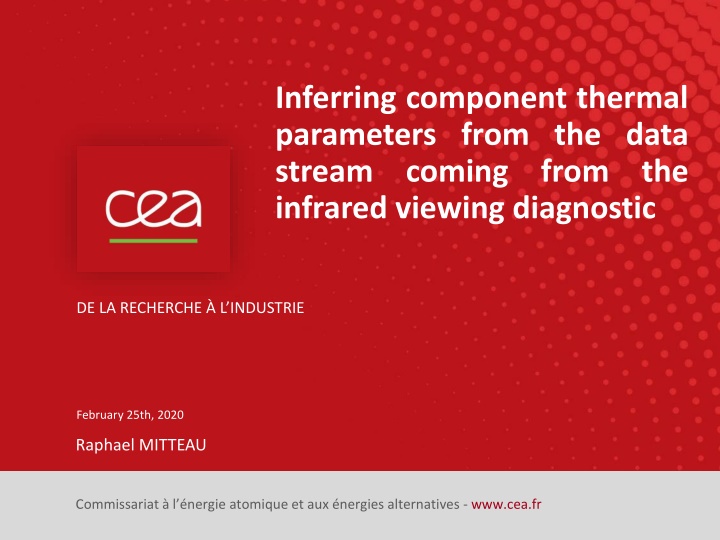
Extracting thermal parameters from infrared data streams plays a crucial role in diagnostic applications. This article discusses the process conducted on February 25th, 2020, by Raphael Mitteau from the Commissariat à l'énergie atomique et aux énergies alternatives. Understanding these components is vital for industrial research and development.

Download Presentation

Please find below an Image/Link to download the presentation.
The content on the website is provided AS IS for your information and personal use only. It may not be sold, licensed, or shared on other websites without obtaining consent from the author.If you encounter any issues during the download, it is possible that the publisher has removed the file from their server.
You are allowed to download the files provided on this website for personal or commercial use, subject to the condition that they are used lawfully. All files are the property of their respective owners.
The content on the website is provided AS IS for your information and personal use only. It may not be sold, licensed, or shared on other websites without obtaining consent from the author.
E N D
Presentation Transcript
Inferring component thermal parameters from the data stream coming infrared viewing diagnostic from the DE LA RECHERCHE L INDUSTRIE February 25th, 2020 Raphael MITTEAU Commissariat l nergie atomique et aux nergies alternatives - www.cea.fr 01 March 2025 Rapha l MITTEAU Commissariat l nergie atomique et aux nergies alternatives
What kind of thermal parameters can be inferred from the temperature time trace ? Measures available from diagnostic systems : Surface temperature (time evolution) of a given spot. Including some assumptions regarding emissivity, reflectivity etc Total power Ptot(time evolution) but usually not the local power density qdeposited Can relevant thermal parameters of a hot spot be inferred (= deducted) from the temperature history ? - Material health (good, bad, armour delamination) - Presence / absence of co-deposit - Component being well cooled or thermally insulated All these information's are relevant for decision-making toward wall monitoring 2 01 March 2025 Rapha l MITTEAU Commissariat l nergie atomique et aux nergies alternatives
4 thermal behaviours, all up to 1000C Power on 1000 Feed forward modelling 500 Temperature ( C) 0 1000 4 thermal behaviours, all calibrated on a prescribed temperature rise of 950 C (from 50 C to 1000 C) 500 All do corresponds to simulated thermal models of possible plasma facing components 0 1000 The power deposition lasts 10 seconds, from 5 to 15 seconds 500 The heat flux density is unknown 0 1000 500 off Time (s) 0 10 20 30 40 3 01 March 2025 Rapha l MITTEAU Commissariat l nergie atomique et aux nergies alternatives
Qualitative human expertise 1000 Heating and cooling ramps are quasi-symmetrical + good match to exponential behaviour Probably a well cooled component 500 Temperature ( C) 0 1000 Heating and cooling are quasi-symmetrical Fast response to Heaviside power steps : low capacity material Look likes a co-deposited layer 500 0 1000 Poor up-down symmetry. Slow return to base temperature : visible effect of radiation cooling 500 0 1000 Poor up-down symmetry. Slow ramp-up plus very slow return to base temperature thermal capacity being filled, radiation cooling 500 Time (s) 0 10 20 30 40 4 01 March 2025 Rapha l MITTEAU Commissariat l nergie atomique et aux nergies alternatives
Unveiling local power density 1000 8.9 MW/m 500 Temperature ( C) 0 1000 While identical max temp 1000 C, quite different power densities 1.7 MW/m 500 Temperature : a poor indication of actual heat load 0 1000 500 3.9 MW/m 0 1000 0.5 MW/m 500 Time (s) 0 10 20 30 40 5 01 March 2025 Rapha l MITTEAU Commissariat l nergie atomique et aux nergies alternatives
Unveiling thermal model 8.9 MW/m 1000 W macrobloc with top heat load and blackbody cooling 500 Temperature ( C) 0 1000 Same as above with addition of low adherence deposit 500 1.7 MW/m 0 1000 3.9 MW/m 500 Thick plate with local heating 10 mm 0 1000 0.5 MW/m 500 Thin plate with uniform heating 1 mm 0 10 20 30 40 6 01 March 2025 Rapha l MITTEAU Commissariat l nergie atomique et aux nergies alternatives
Provisional conclusions & Statement of work The temperature itself is of little use for knowing component status, the local heat flux density being unknown Valuable knowledge about component status is present in the thermal dynamics of a hot spot Numerical algorithms to be developed, to reveal that hidden data Historical method : search the 'thermal time constant' ( ) Expected = 0.7 second Measured = 0.3 second Difference attributed to thin deposited layer 7 01 March 2025 Rapha l MITTEAU Commissariat l nergie atomique et aux nergies alternatives
Estimating the thermal time constant of PFCs Power Needed : a method allowing to estimate t on most plasma discharges The usual method : hunt for power time evolution with abrupt change and long enough plateaux before and after the change - Ramped power - No power plateau Time Power time profile for a typical selection of WEST plasma discharges of C3B btw #53800 et #53950 At WEST, less than 10% of the plasma discharges are like this 8 01 March 2025 Rapha l MITTEAU Commissariat l nergie atomique et aux nergies alternatives
Temperature history identification with Proportional control law Order(i) Result(i) Example with up= 1 second and down= 0.2 second Process action(i+1) = G x (Ri Oi) 8 seconds heating Non-Heaviside function 01 March 2025 Rapha l MITTEAU Commissariat l nergie atomique et aux nergies alternatives
Proportional Control real power time history Simple time history Unsteady time history Power time profile (normalised to 1) Power time profile (normalised to 1) Calculated Temperature, using tau_up = 2 seconds and tau_down = 5 seconds Calculated Temperature, using tau_up = 2 seconds and tau_down = 5 seconds 01 March 2025 Rapha l MITTEAU Commissariat l nergie atomique et aux nergies alternatives
Optimisation toward best fit by comparison to temperature history Define cost function Temperature Minimisation algorithm Temperature or power, normalised to 1 (.) Zone "pipe" - 53827 Power Calculated Temperature Script output : up = 0.8 s down = 0.5 s Measured Temperature Time (s) 01 March 2025 Rapha l MITTEAU Commissariat l nergie atomique et aux nergies alternatives
Stability of the identification technique Same hot spot, another discharge Zone "pipe" - 53816 Power 10-20% accuracy Calculated Temperature Measured Temperature 01 March 2025 Rapha l MITTEAU Commissariat l nergie atomique et aux nergies alternatives
Large use on C3 campaign Results ( Strengths / weaknesses ( next slides ) next slides ) 01 March 2025 Rapha l MITTEAU Commissariat l nergie atomique et aux nergies alternatives
3 hot spots: div_bas (=inertiel), pipe (= cooled), electrode (=codeposit) Scale [0 14] seconds Scale [ 0 2] secondes Algorithm stability (no crash good) Some difference btw tau_up and tau_down Visible fast & slow components More steadiness needed discussed next slide 01 March 2025 Rapha l MITTEAU Commissariat l nergie atomique et aux nergies alternatives
Normalisation Requires normalised signals = "min-max normalised" Power shall be between 0 and 1 Temperature shall be btw 0 and 1 Min max normalisation to be improved toward more stable estimates 200 C UA 1.0 Temperature 0.8 100 C 10 MW 0.6 Power x 10 5 MW 0.4 0.2 0 0 C 0. Zone "pipe" 53826 0 20s 10s 0 20s 10s Time Time 01 March 2025 Rapha l MITTEAU Commissariat l nergie atomique et aux nergies alternatives
Issue 1 : temperature drift Probable cause : Photonic background increase or progressive increase of an inertial component coinciding cartesian reflexion Power Final temperature plateau hotter than initial t_begin t_end Possible correction of the temperature time profile with affine law btw t_begin and t_end doable, but shall seek/keep justification Correction or no correction ? Sometimes meaningfull sometime not. 01 March 2025 Rapha l MITTEAU Commissariat l nergie atomique et aux nergies alternatives
Issue 2 Non proportional plateaus Power Temperature Zone "pipe" for #53897 Ratio T_stable / P_stable changes Possible effect of rad power, power deposition mechanism . Ratio T / P = 1 (par d finition, plateau max de la normalisation) Ratio T / P = 0.5 T / P = 0.8 This variation perturbs temperature reconstruction from power time trace Maybe work shall be done for each discharge phase separately phase 1, phase 2 , phase 3 01 March 2025 Rapha l MITTEAU Commissariat l nergie atomique et aux nergies alternatives
Conclusion A algorithm based on proportional control rule is efficient for estimating the thermal time constant, even for plasma discharges having a power-time profile having no plateau Very basic algorithm, can be implemented in any language (matlab, excel, python, C, whatever) Consolidation work still to be done (exception handling, etc ) More work shall be done toward increasing robustness, in presence of signal perturbations (parasitic signal, non- proportional plateaus) Quality data signal helps getting good (= stable) estimates 01 March 2025 Rapha l MITTEAU Commissariat l nergie atomique et aux nergies alternatives


, pipe (= cooled),")