Learn about inflation, its impact on the economy, different types like creeping and hyperinflation, causes such as demand-pull and cost-push, and how it affects consumer purchasing power.
Please find below an Image/Link to download the presentation.
The content on the website is provided AS IS for your information and personal use only. It may not be sold, licensed, or shared on other websites without obtaining consent from the author. If you encounter any issues during the download, it is possible that the publisher has removed the file from their server.
You are allowed to download the files provided on this website for personal or commercial use, subject to the condition that they are used lawfully. All files are the property of their respective owners.
The content on the website is provided AS IS for your information and personal use only. It may not be sold, licensed, or shared on other websites without obtaining consent from the author.
Inflation Inflation poses a serious threat to the growth momentum. Whatever be the cause, the fact remains that inflation is something which needs to be tackled with great urgency [Dr. Manmohan Singh, Prime Minister of India, February 4, 2011, New Delhi
Inflation Inflation is the rise in the price of goods and services within an economy over a period of time due to which each unit of currency has less purchasing power. It is estimated as the percentage rate of change in price index over the reference time period. Currently in India inflation rate is measured with the help of the Consumer Price Index- combined (Base year- 2010). Till April 2014, the Inflation rate was measured with the help of WPI (Wholesale Price Index). Rate of Inflation= (Current period index)/(Reference Period Price Index) 100 price index-Reference period price
Types 1. Creeping Inflation: This occurs when the rise in price is very slow. A sustained annual rise in prices of less than 3 per cent per annum falls under this category. Such an increase in prices is regarded safe and essential for economic growth. 2. Walking Inflation: Walking inflation occurs when prices rise moderately and annual inflation rate is a single digit. This occurs when the rate of rise in prices is in the intermediate range of 3 to less than 10 per cent. Inflation of this rate is a warning signal for the government to control it before it turns into running inflation.
Types 3. Running Inflation: When prices rise rapidly at the rate of 10 to 20 per cent per annum, it is called running inflation. This type of inflation has tremendous adverse effects on the poor and middle class. Its control requires strong monetary and fiscal measures. 4. Hyperinflation: Hyperinflation occurs when prices rise very fast at double or triple digit rates. This could get to a situation where the inflation rate can no longer uncontrollable. Prices could rise many times every day. Such a situation brings a total collapse of the monetary system because of the continuous fall in the purchasing power of money. be measurable and absolutely
Causes of Inflation Demand-pull inflation is caused by an increase in the conditions of demand. These could either be an increase in the ability to buy goods or an increase in the willingness to do so. Cost-push inflation arises from anything that causes the conditions of supply to decrease. Some of these factors include a rise in the cost of production, an increase in government taxation and a decrease in quantity of goods produced.
Demand Pull Inflation Demand-pull inflation occurs when the overall demand for goods and services in an economy increases more rapidly than the economy's production capacity. It creates a demand-supply gap with higher demand and lower supply, which results in higher prices. For instance, when the oil producing nations decide to cut down on oil production, the supply diminishes. It leads to higher demand, which results in price rises and contributes to inflation
Demand Pull Inflation 1. Increase in Money Supply: Inflation is caused by an increase in the supply of money which leads to increase in aggregate demand. The higher the growth rate of the nominal money supply, the higher is the rate of inflation. 2. Increase in Disposable Income: When the disposable income of the people increases, it raises their demand for goods and services. 3. Increase in Public Expenditure: Government activities have been expanding much with the result that government expenditure has also been increasing at a phenomenal rate, thereby raising aggregate demand for goods and services. Governments of both developed and developing countries are providing more facilities under public utilities and social services with the result that they help in increasing aggregate demand.
Demand Pull Inflation 4. Increase in Consumer Spending: The demand for goods and services increases when consumer expenditure increases. They may also spend more when they are given credit facilities to buy goods on hire- purchase and installment basis. 5. Deficit Financing: In order to meet its mounting expenses, the government resorts to deficit financing by borrowing from the public and even by printing more notes. This raises aggregate demand in relation to aggregate supply, thereby leading to inflationary rise in prices. This is also known as deficit-induced inflation
Demand Pull Inflation 6. Black Money: The existence of black money in all countries due to corruption, tax evasion etc. increases the aggregate demand. People spend such unearned money extravagantly, thereby creating unnecessary demand for commodities. This tends to raise the price level further. 7. Repayment of Public Debt: Whenever the government repays its past internal debt to the public, it leads to increase in the money supply with the public. This tends to raise the aggregate demand for goods and services and to rise in prices. 8. Increase in Exports: When the demand for domestically produced goods increases in foreign countries, this raises the earnings of industries producing export commodities. These, in turn, create more demand for goods and services within the economy, thereby leading to rise in the price level.
Supply Side Inflation There are certain factors which operate on the opposite side and tend to reduce the aggregate supply. The responsible factors are:
Supply Side Inflation 1. Shortage of Factors of Production: One of the important causes affecting the supplies of goods is the shortage of such factors as labour, raw materials, power supply, capital, etc. They lead to excess capacity and reduction in industrial production, thereby raising prices. 2. Industrial Disputes: In countries where trade unions are powerful, they also help in curtailing production. Trade unions resort to strikes and if they happen to be unreasonable from the employers viewpoint and are prolonged, they force the employers to declare lockouts. In both cases, industrial production falls, thereby reducing supplies of goods. If the unions succeed in rising money wages of their members to a very high level than the productivity of labour, this also tends to reduce production and supplies of goods. Thus they tend to raise prices. 3. Natural Calamities: Drought or floods is a factor which adversely affects the supplies of agricultural products. The latter, in turn, create shortages of food products and raw materials, thereby helping inflationary pressures.
Supply Side Inflation 4. Artificial Scarcities: Artificial scarcities are created by hoarders and speculators who indulge in black marketing. Thus they are instrumental in reducing supplies of goods and raising their prices. 5. Increase in Exports: When the country produces more goods for export than for domestic consumption, this creates shortages of goods in the domestic market. This leads to inflation in the economy. 6. International Factors: In modern times, inflation is a worldwide phenomenon. When prices rise in major industrial countries, their effects spread to almost all countries with which they have trade relations. Often the rise in the price of a basic raw material like petrol in the international market leads to rise in the prices of all related commodities in a country.
Cost Push inflation Cost-push inflation occurs when overall prices increase (inflation) due to increases in the cost of wages and raw materials. Higher costs of production can decrease the aggregate supply (the amount of total production) in the economy. Since the demand for goods hasn't changed, the price increases from production are passed onto consumers creating cost-push inflation. The most common cause of cost-push inflation starts with an increase in the cost of production, which may be expected or unexpected. For example, the cost of raw materials or inventory used in production might increase, leading to higher costs.
Cost Push inflation For cost-push inflation to take place, demand for the affected product must remain constant during the time the production cost changes are occurring. To compensate for the increased cost of production, producers raise the price to the consumer to maintain profit levels while keeping pace with expected demand.
Cost Push inflation Cost-push inflation occurs when overall prices increase (inflation) due to increases in the cost of wages and raw materials. Cost-push inflation can occur when higher costs of production decrease the aggregate supply (the amount of total production) in the economy.
National Income The net value of all economic goods and services produced within the domestic territory of a country in an accounting year plus the net factor income from abroad. National income is the sum total of factor incomes generated by the normal residents of a country in the form of wages, rent, interest and profit in an accounting year . Central Statistical Organization
National Income National income accounts have three sides: a product side, an expenditure side and an income side. The product side measures production based on concept of value added. The expenditure side looks at the final sales of goods and services. Whereas the income side measures the distribution of the proceeds from sales to different factors of production.
National Income The national income of any country means the entire value of the commodities and services produced by any country throughout its financial year. It is valued in terms of money. The national income of any country is the total amount of earnings that is acquired by it through several economic activities in one year. It comprises wages, interest, rent and profit obtained through various factors of production entrepreneurship of a nation. It is beneficial in determining the progress of the country. like labor, capital, land and
National Income NI is also known as National Income at factor cost which means the overall income earned by resources for their contribution of land, labor, capital and organizational capability. Therefore, the amount of the income received by factors of production in the form of rent, wages, interest and profit is called National Income.
Formula NI = NNP + Subsidies - Indirect Taxes GNP = Depreciation + Subsidies - Indirect Taxes NI = C + G + I + (X-M) + NFIA - Depreciation - Indirect Taxes + Subsidies
Features Macroeconomic concept Macroeconomics explores how an economy functions as a whole and focuses on aggregate measures. Since national income is an aggregate term, it can be considered a macroeconomic concept. Flow concept National income is measured over a particular span of time. It can also be said that national income has an element of time linked to it. Therefore, it is a flow concept. The Monetary Value of Commodities National income is the entire market value of all the final goods and services in terms of the money generated within the national territory during an accounting year, it can be considered that national income is the money valuation of goods
Objectives To compute the economic advancement of a country. To compare the economic growth of several countries. To assist the government in planning and implementing various projects. To find out the limitations and benefits of various economic activities like production, consumption and distribution
National Income National income is measured by several concepts of National Income that include GDP, GNP, NNP, NI, PI, DI, and PCI which give an account of the particulars of economic activities
GDP Gross domestic product (GDP) is a measure of the market value of all final economic goods and services, gross of depreciation, produced within the domestic territory of a country during a given time period. It is the sum total of 'value added' by all producing units in the domestic territory and includes value added by current production by foreign residents or foreign-owned firms.
Formula National Income = C + I + G + (X -M) Where, C stands for consumption. I stands for total investment expenditure G stands for the expense made by the government X stands for exports and M stands for imports.
Gross National Product (GNP) GNP is the market value of final goods and services produced by the residents of the country in the domestic territory as well as outside the country in a year. GNP is the measure of goods and services that the citizens of the country produce regardless of their location. GNP = GDP+NFIA GNP = C + I + G + (X-M) + NFIA Where, C = Consumption I = Investment G = Government expenditure (X-M) = Export minus import NFIA = Net factor income from abroad
Net National Product (NNP) at Market Price NNP is the market value of the net yield of final goods and services produced by a country s economy during a year and the net factor income(NFIA) from outside the country. NNP = GNP - Depreciation NNP = C + I + G + (X-M) + NFIA - IT - Depreciation Where, C = Consumption I = Investment G = Government expenditure (X-M) = Export minus import NFIA = Net factor income from abroad IT = Indirect Taxes
Disposable Income (DI) It is that income that is left over with the individuals after the payment of direct taxes from personal income. It is the true income left for disposal or that can be spent for individual consumption. DI = PI - Direct Taxes
Per Capita Income (PCI) PCI is measured by dividing the overall national income of the country by the total population of a country. PCI = Total National Income / Total National Population
COST-VOLUME-PROFIT (CVP) ANALYSIS CVP analysis examines the interaction of a firm s sales volume, selling price, cost structure, and profitability. It is a powerful tool in making managerial decisions including marketing, production, investment, and financing decisions. How many units of its products must a firm sell to break even? How many units of its products must a firm sell to earn a certain amount of profit? Should a firm invest in highly automated machinery and reduce its labor force? Should a firm advertise more to improve its sales?
CVP Model Assumptions Selling price is constant Costs are linear and can be divided into variable and fixed elements. In multi-product companies, sales mix is constant In manufacturing companies, inventories do not change
Benefits Assists in establishing prices of products. Assists in analyzing the impact that volume has on short-term profits. Assists in focusing on the impact that changes in costs (variable and fixed) have on profits. Assists in analyzing how the mix of products affects profits.
Limitations of CVP Analysis Analysis assumes a linear revenue function and a linear cost function. The analysis assumes that price, total fixed costs, and unit variable costs can be accurately identified and remain constant over the relevant range. The analysis assumes that what is produced is sold. For multiple-product analysis, the sales mix is assumed to be known. The selling prices and costs are assumed to be known with certainty.
Break Even Point Having revenue exactly equal to expenditure, thus showing neither profit nor loss.
Break Even Analysis Sales Variable costs Fixed cost = Profit (S - VC FC = P) Sales Variable costs = Fixed costs + Profit (S - VC = FC + P) Sales minus variable costs is called Contribution. (S - VC = C) Contribution = Fixed costs + Profit (C = FC + P) At break even point, profit is zero. Contribution = Fixed Costs (at break even point) or (SP - VC) Q = F Where, SP is selling price, VC is the variable costs, F is a fixed costs and Q is the number of units produced and sold
P/V Ratio Total contribution divided by total sales is called profit-volume ratio or contribution ratio (P/V ratio). Break-even point can be determined with the help of P/V ratio
Example A company producing a single product and sells it at Rs. 10 per unit. Variable cost is Rs. 6 per unit and fixed cost is Rs. 40,000 per annum. Calculate (a) Break even point.
Margin of Safety The margin of safety is the excess of budgeted (or actual) sales over the break-even volume of sales. It is the amount by which sales can drop before losses begin to be incurred. Margin of safety in Rs. = Total sales Break-even sales
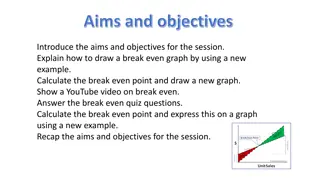
Graphical Method The break-even point can also be shown graphically. The BEP chart shows the relationships between cost, volume and profit at various levels of output. Fixed costs, variable costs and sales revenues are shown on Y-axis and volume of out on X-axis. The break-even point is that point at which the total cost line and total sales line intersect each other. This point represents no profit, no loss
Steps Sales volume is plotted on x-axis. Sales volume may be expressed in terms of value (rupee), units or as percentage of capacity. Cost and Revenue are depicted in y-axis. Fixed costs remains constant irrespective to the sales volume. Hence it is parallel to the x-axis Variable cost starts from (0,0) because no sales volume, no variable cost and as the volume increases variable cost also increases. When a parallel line of variable cost drawn from the fixed cost line in y - axis, it depicts the total cost line. The sales revenue curve also starts from (0,0).
Steps The point of intersection of sales revenue line and total cost line depicts, break even point. The area to the left side of break even point depicts loss zone as cost curve is at a higher level and sale revenue line is at a lower level. The area to the right hand side of break even point is call profit zone as sale revenue line lies at a higher level than the total cost line.


")
 at Market Price")
")
")
 ANALYSIS")