INFOGRAPHICS
Teams will create infographics about assigned STIs, emphasizing research and design. Groups of 2-4 will work together, ensuring everyone contributes to the project. The creation process involves researching the STI, understanding how to visually represent the information, and making a rough sketch of the design. Important considerations include essential data, visual layout, and citation practices to create informative and engaging presentations.

Download Presentation

Please find below an Image/Link to download the presentation.
The content on the website is provided AS IS for your information and personal use only. It may not be sold, licensed, or shared on other websites without obtaining consent from the author.If you encounter any issues during the download, it is possible that the publisher has removed the file from their server.
You are allowed to download the files provided on this website for personal or commercial use, subject to the condition that they are used lawfully. All files are the property of their respective owners.
The content on the website is provided AS IS for your information and personal use only. It may not be sold, licensed, or shared on other websites without obtaining consent from the author.
E N D
Presentation Transcript
INFOGRAPHICS COLLABORATIVE TASK ON STI S HEALTH 8 -ORANGE
AGENDA You will be in teams to create an infographics about an STI. You will be assigned an STI You can make teams of 2,3,or 4 More than 4 is too many and someone will be left doing nothing!!! You will be self guided today (Which means you and your teammates need to read the instructions in this PowerPoint on your own and accomplish the task as a team. How you organize your team is up to you You can elect or vote on a leader You can create a democracy (everyone votes on every decision and majority rules) You can decided that everyone on the team needs to agree EVERYONE needs to be working There is research tasks Research on the STI Research on how to create an infographic Design Draft PowerPoint
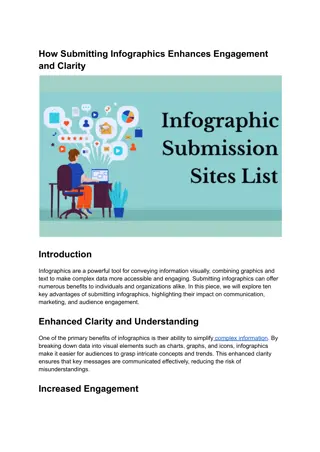
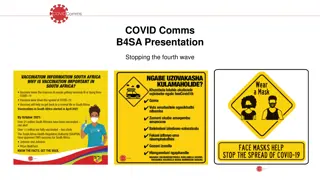
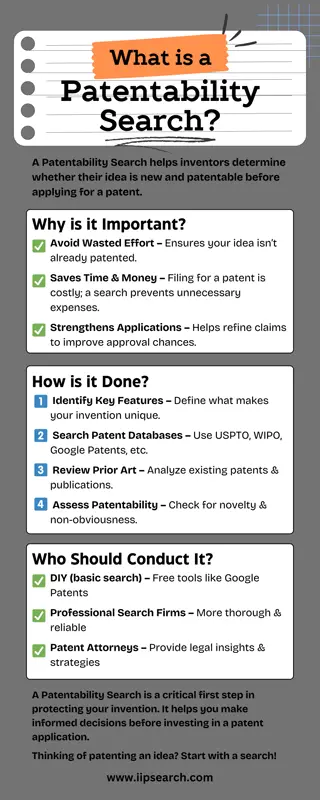
TASK Infographics are an increasingly popular way of sharing information in newspapers, magazines, and online news sites. These visual representations of knowledge and information are designed to make complex ideas and large amounts of data easy to understand. There are many ways to create infographics. After exploring a variety of examples, you will create your own infographic poster that will help others better understand an STI from our Health curriculum.
HERE ARE A FEW EXAMPLES OF INFOGRAPHICS. 70 Years of Batman Evolution +50 Ways of Visualizing BP s Dark Mess Then/Now: Same Camping Gear Essentials, But Better Take a few minutes to explore other infographics
CREATE The process begins not with making the infographic, but with research. Your team will need time to research the STI as well as think about how you will visually convey it. Infographics, especially those that include lots of data, ALWAYS include citations. Please remember to capture citations for information you are including in your posters. When your notes are complete and you are confident about the information, your team should produce a rough visual sketch of how you will share the information. Organization and design of the poster will be critical in informing others..
CREATE As you plan out design, teams should ask and answer questions like: Which information, facts, and data are essential to include? Which aren t? What colors and layout works best in sharing the information? What graphs and graphics best convey information and data to the viewer? What is the order, or flow, of information?
CREATE You may want to take a moment to look back at your samples and discuss how various infographics are structured. Since the point of an infographic is to transfer knowledge and information quickly, the final poster should be informative, simple, engaging, and design-friendly.
THIS IS AN INFOGRAPHIC EXPLAINED USING LEGOS
ASSESSMENT http://www.schrockguide.net/uploads/3/9/2/2/392267/schrock_infographic_rubric.pdf Your infographics will be assessed based on this rubric.
WE HAVE INCLUDED A VIDEO TO HELP YOU. Feel free to look up your own video