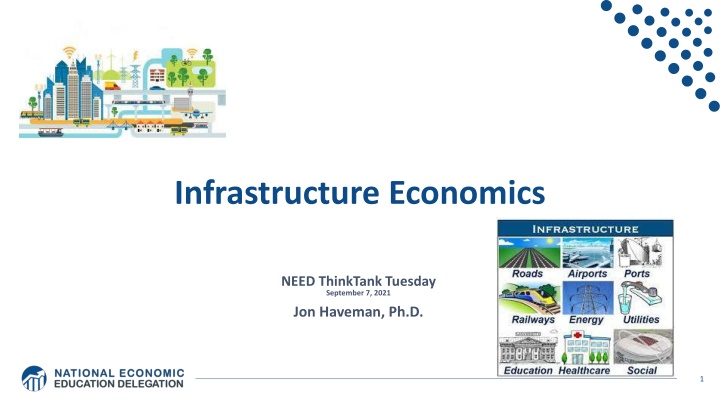
Dive into the realm of infrastructure economics with a focus on defining infrastructure, its significance in economic models, investment considerations, and current state in the US. Explore various types of infrastructure and their impact on society and the economy.
Please find below an Image/Link to download the presentation.
The content on the website is provided AS IS for your information and personal use only. It may not be sold, licensed, or shared on other websites without obtaining consent from the author. If you encounter any issues during the download, it is possible that the publisher has removed the file from their server.
You are allowed to download the files provided on this website for personal or commercial use, subject to the condition that they are used lawfully. All files are the property of their respective owners.
The content on the website is provided AS IS for your information and personal use only. It may not be sold, licensed, or shared on other websites without obtaining consent from the author.
Who Are We? Honorary Board: 54 members - 2 Fed Chairs: Janet Yellen, Ben Bernanke - 6 Chairs Council of Economic Advisers o Furman (D), Rosen (R), Bernanke (R), Yellen (D), Tyson (D), Goolsbee (D) - 3 Nobel Prize Winners o Akerlof, Smith, Maskin Delegates: 600+ members - At all levels of academia and some in government service - All have a Ph.D. in economics - Crowdsource slide decks - Give presentations Global Partners: 45 Ph.D. Economists - Aid in slide deck development 2
Credits and Disclaimer This slide deck was authored by: - Mallika Pung, University of New Mexico Valencia - Jon Haveman, NEED Disclaimer - NEED presentations are designed to be nonpartisan. - It is, however, inevitable that the presenter will be asked for and will provide their own views. - Such views are those of the presenter and not necessarily those of the National Economic Education Delegation (NEED). 3
Outline What do we mean by infrastructure? Current state of infrastructure in the US Infrastructure in economic models Why should we invest in infrastructure? Public or private infrastructure investment Infrastructure investment in the US
What is a Useful Definition of Infrastructure? Infra- means "below;" - So the infrastructure is the "underlying structure" of a country and its economy. Miriam-Webster definition of Infrastructure: - the system of public works of a country, state, or region o also: the resources (such as personnel, buildings, or equipment) required for an activity - the underlying foundation or basic framework (as of a system or organization) - the permanent installations required for military purposes 5
Different Kinds of Infrastructure (& Examples) Provide basic services. - Electricity, water, broadband (?). Improve the performance of the economy. - Roads, bridges, airports, seaports .. - General R&D? - Education Make people s lives better. - Roads, bridges, airports - Protection from natural disaster - Child care, education. 6
Infrastructure Is it: Traditional: - Roads, bridges, tunnels, airports, seaports, dams, water, electrical, and telephone systems? Additional: - Broadband What about: - R&D? Human capital? Institutions? What definition of infrastructure is the most useful today? 7
Categories of Infrastructure Transportation - Highways, roads, bridges - Mass transit - Airports, seaports Water - Supply - Distribution Waste management - Trash, recycling, and wastewater Energy - Generation - Transmission Communications - Telephone - Internet 8
What is in it? Transportation Other Roads, bridges, major projects $110 Billion Broadband $65 Billion Passenger and freight rail $66 Billion Power infrastructure $73 Billion Public transit $39 Billion Clean drinking water $55 Billion Airports $25 Billion Resilience and waste water storage $50 Billion Port infrastructure $17 Billion Removal of pollution from water and soil $21 Billion Transportation safety programs $11 Billion Electric vehicles $7.5 Billion Zero and low-emission buses and ferries $7.5 Billion Revitalization of communities $1 Billion 11
What is missing? Strategic thinking: - Long term thinking, planning, prioritizing. Meaningful climate resilience planning. Education & R&D. Expanding/insuring water supplies. Hazardous waste. A meaningful magnitude of spending? 12
Funding According to the White House Unspent emergency relief funds Targeted corporate user fees. Strengthening tax enforcement crypto currencies. Revenue generated from higher economic growth. 13
Infrastructure in economic models Vast macroeconomic literature on relation between infrastructure and economic growth Wide variation in the magnitude of economic effects of infrastructure spending on growth or productivity
Econometric issues that make the task difficult Direction of causality - Between infrastructure investment and productivity - Between infrastructure investment and output Spurious correlation - Non stationary data - Ignoring unobserved factors that might affect both infrastructure investment and output Heterogenous Effects
Why Should we Invest in Infrastructure? Vital ingredient to economic growth - Facilitates economies of scale, raises productivity A 10% rise in infrastructure assets directly increases Real GDP per capita by 0.7 1%. o Assuming increases in spending translate 1-1 to the stock of assets: ~$50 billion will raise GDP per capita in the US by ~$300 -$450. o Productivity growth raises standards of living
Why Should we Invest in Infrastructure? Vital ingredient to economic growth - Facilitates economies of scale, raises productivity - Reduces trade costs by improving access to markets o Port capacity improvement o Reducing traffic congestion - Reduces effective distances, facilitates trade and agglomeration - Advances public health by providing clean water and effective sewage systems
Case for Spending More on Infrastructure Maintenance Rundown infrastructure increases costs - Longer travel time higher costs for businesses - Wear on cars more spending on car repairs faster car depreciation - Vehicle deterioration Additional fuel consumption The average motorist in the U.S. is losing $523 annually -- $112 billion nationally -- in additional vehicle operating costs as a result of driving on roads in need of repair. -- November 2016 Urban roads TRIP report Deferred maintenance is a debt burden on the future generations.
Public or Private Infrastructure Investment? Nonrival consumption Non-excludable use Social benefits might exceed expected financial return. Private sector likely to underprovide key types of infrastructure. Economic case for public provision of infrastructure assets. 20
Public or Private Infrastructure Investment? A few arguments for public provision: - Provision of public infrastructure increases productivity of private infrastructure o Incentivizes private capital investment, o Increases labor productivity, o Indirectly increases employment and wages. 21
Public or Private Infrastructure Investment? A few more arguments for public provision: - Provides short-term stimulus to the economy by creating jobs - Promotes trade and commerce - Promotes equity o Pays prevailing wages o More demographically inclusive o Encompasses all congressional districts - Promotes public health and well-being - Improves public safety - Affects not just the present but the future generations also Some of these are more debatable than others 22
Empirical Evidence on Effect of Govt Spending In studies from 80s, early 90s: - A 1% increase in the stock of public capital raised GDP by 0.39% In more recent studies - by only 0.08% in the short run, 0.12% long run In terms of multiplier, most short-term estimates are less than 1 - Due to negative effects of tax/interest rate increases on private C and I Longer term multiplier - OECD panel data 1.6 - US interstate highway system 1.8 23
Empirical Evidence on Effect of Govt Spending Estimates from the 2009 American Recovery and Reinvestment Act - Each $100,000 spent led to 0.8 job-years created - Highway construction employment unaffected in 2009-10 o fell sharply afterwards - Significant crowd-in of state and local highway spending o For each $1 of federal grant and additional $2.30 in state spending 24
Infrastructure Investment in the US Transportation, drinking water, and wastewater infrastructure - mainly funded by the public sector Publicly owned transportation infrastructure - Highways - Mass transit - Aviation - Water transportation - Rail Publicly owned water infrastructure - Water utilities - Water resources In 2017, Federal, State and Local governments spent - $441 billion on infrastructure - 2.3% of gross domestic product
Government Spending on Infrastructure, 2017 177 Billions of 2017 Dollars 113 70 37 29 10 5 Highways Water Utilities Mass Transit Aviation Water Resources Water Rail Transportation Source: Congressional Budget Office
Spending by Category and Level of Govt Capital Operation and Maintenance 300 300 250 250 200 200 150 150 State and Local 100 100 50 50 Federal 0 0 1959 2004 1995 1956 1962 1965 1968 1971 1974 1977 1980 1983 1986 1989 1992 1995 1998 2001 2007 2010 2013 2016 1956 1959 1962 1965 1968 1971 1974 1977 1980 1983 1986 1989 1992 1998 2001 2004 2007 2010 2013 2016 Source: Congressional Budget Office
What About Private Sector Investment? State and local governments own almost all of the nation s transportation and water infrastructure. Most of the private-sector investment in these occurs through public- private partnerships for publicly owned infrastructure.
What Is a Public-Private Partnership? Per Engel et al. (2011) an agreement by which the government contracts a private company to build or improve infrastructure works and to subsequently maintain and operate them for an extended period (for example, 30 years) in exchange for a stream of revenues during the life of the contract New federal investment tends to favor new construction Traditional procurement separates design, construction and maintenance aspects Contractors involved in new construction not incentivized to build to minimize long term maintenance costs PPP helps correct this incentive problem.
Types of PPP contracts PPP contracts differ based on the amount of risk transferred from the public to the private sector: - Design-Build (DB) - Design-Build-Operate-Maintain (DBOM) - Design-Build-Finance-Operate-Maintain (DBFOM) - Similarly, we can have DBF, DBFM, etc.
Few Public-Private Partnerships in the US Colorado I-70 Project Denver FasTracks commuter and light rail project in Colorado, Goethals Bridge reconstruction project linking New York City and New Jersey Bayonne Water Joint Venture LLC project, a water and wastewater PPP in New Jersey Automated People Mover (APM) project at Los Angeles International Airport (LAX) LaGuardia Airport Terminal B P3 project
Few Public-Private Partnerships in the US A few P3s in California - Route 91 toll lanes in Orange County - Route 125 toll road in San Diego County - Presidio Parkway project connecting the City of San Francisco to the Golden Gate Bridge
An Alternative Financing Tool User Fees Make those who use infrastructure more heavily, pay for it. - User fees help in appropriately rationing assets to the space. - Help in demand management where congestion is an issue
An Alternative Financing Tool User Fees Singapore s congestion pricing model - Singapore -- an island nation with land area of 250 sq. miles - Limited street capacity in the central business area - Heavy congestion - Electronic Road Pricing (ERP) System launched in 1998 o variable pricing designed to respond to congestion in real-time - Complementary policies to ERP o Parking fees inside the restriction zone doubled o Buses and bus frequency increased o HOV+4 lanes established o 15,000 park-and-ride spaces were established outside the restriction zone
Another Aspect of Infrastructure Broadband Talk of a digital divide ubiquitous - especially in light of the current pandemic 21 million+ Americans lack meaningful access to the internet - Meaningful access: 25 Mbps download and 3 Mbps upload - 14.5 million have no access at all Lack of access more common among the less educated, low income, living in rural or suburban areas 9 million+ school children lacked internet access for online schoolwork 38
Broadband Access Modern-day equivalent of the interstate highway system Lack of access not just a rural problem - In 2016, 57% of households in Detroit, MI; - 49% in Memphis, TN and - 48% in Cleveland, OH without fixed broadband Digital redlining within cities Where available, service is often limited to a single service provider natural monopolies - Due to high up-front fixed costs of laying fiber optic lines 39
Solutions to the Access Problem FCC Launched a $20 billion Rural Digital Opportunity Fund in February 2020 - $6 million budget - Target census blocks that without 25/3 Mbps broadband Taking matters into their own hands, cities and communities: - Building municipal infrastructure and cooperatives providing broadband - Despite legal barriers or bans on publicly owned networks in 19 states - 850+ communities served by a municipal network or cooperative - Community-owned networks are less expensive and have more transparent pricing than private ISPs Harvard Study 40
Enormous Economic Benefits to Access Individual benefits: - Better health and life outcomes. o Access to health and education online. o Job search and development of digital skills. - Higher property values. - Increased population and job growth. o Higher rates of business formation. Broader economic benefits: - World Bank o 10% increase in access yields a 1.2% jump in real incomes. - Indiana o ROI = 300-400%. 41 Brookings; The Benefits and Costs of Broadband Expansion, Aug 18, 2021
Technological Advancements of the Future to the Rescue? Low Earth Orbit (LEO) satellite internet - On June 13, 2020 Elon Musk s SpaceX launched 58 satellites into low earth orbit as part of the Starlink program. - Aims to provide low-latency (less lag) satellite internet. - Better internet coverage than traditional communications satellites. - Could potentially provide high quality internet to homes and businesses without access to cable, fiber, or reliable cellular internet. 42
Too Much, Too Soon? Too Little, Too Late? Is the current infrastructure package appropriate? The United States has enormous needs. - Basic infrastructure bridges, roads, etc. - Other: o General R&D: 2% of GDP in the 1950s, currently 0.75%. Is now the time to borrow extensively? - Have just borrowed > $4 Trillion. - Interest rates are very low. Given the state of our infrastructure, the ROI can be very high. 44
Summary Infrastructure investment is important. Current state of US infrastructure leaves a lot to be desired for. Public infrastructure investment can play a vital role in long run growth. - Improve mobility - Raise private capital productivity - Improve health May not be ideal as short-term stimulus. Arguments for and against going big. - ROI arguments likely carry the day in todays interest rate environment. - Risk is always the impact on the debt. 48
Thank you! Any Questions? www.NEEDelegation.org <presenter name> <presenter email> Contact NEED: info@needelegation.org Submit a testimonial: www.NEEDelegation.org/testimonials.php Become a Friend of NEED: www.NEEDelegation.org/friend.php 49
Current State of Transportation Infrastructure Roads - Over 4 million miles of roads. - In 2018: 3.3 trillion VMT (Vehicle Miles Traveled). - 40%+ of America s urban interstates are congested. - In 2017, 8.8 billion hours of traffic delay. o Costing the country $166 billion in wasted time and fuel. The average auto commuter spends 54 hours in congestion and wastes 21 gallons of fuel due to congestion at a cost of $1,080 in wasted time and fuel. -- 2019 Urban Mobility Report, Texas A&M Transportation Institute - 42,060 motor vehicle fatalities in 2020 (8% increase over 2019). 50


")