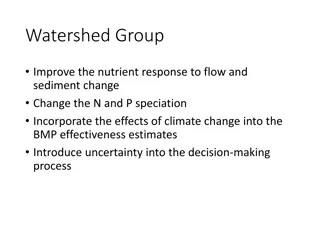
Innovative Tour Formation Procedure in MAG Activity-Based Model
Discover the pioneering approach to tour formation in the MAG Activity-Based Model, revolutionizing the process with a focus on activities and time-space constraints. Explore the new CT-RAMP version implemented in the Phoenix ABM and Ohio 3C for optimized tour generation based on preferences and priorities.

Download Presentation

Please find below an Image/Link to download the presentation.
The content on the website is provided AS IS for your information and personal use only. It may not be sold, licensed, or shared on other websites without obtaining consent from the author. If you encounter any issues during the download, it is possible that the publisher has removed the file from their server.
You are allowed to download the files provided on this website for personal or commercial use, subject to the condition that they are used lawfully. All files are the property of their respective owners.
The content on the website is provided AS IS for your information and personal use only. It may not be sold, licensed, or shared on other websites without obtaining consent from the author.
E N D
Presentation Transcript
APPLICATION EXPERIENCE OF A NEW TOUR FORMATION PROCEDURE IN THE MAG ACTIVITY-BASED MODEL Binny Paul , James Hicks, Peter Vovsha (Parsons Brinckerhoff) Vladimir Livshits, Kyunghwi Jeon (MAG) TPAC 2015 Systems Analysis Group
Background & Motivation By definition central unit of analysis for ABMs are activities Tour and trips emerge from activity participation and corresponding time-space constraints Most ABMs in research/practice treat tours as central unit of analysis Tours are generated initially, location and mode are modeled first for the primary destination and details of stops are added later Not behaviorally appealing New tour formation procedure - Latest version of CT-RAMP Implemented for the Phoenix ABM (MAG) and Ohio 3C (MORPC, NOACA, OKI) TPAC 2015 Systems Analysis Group
Modeling Approach 1. Generation and scheduling of prioritized activities and associated tour skeletons 2. Formation of individual day segments 3. Allocation of other activities to day segments 4. Tour formation based on temporal, sequential and location preferences TPAC 2015 Systems Analysis Group
Activities Prioritized Special events, mandatory, school escorting & joint Fixed location, pre-determined schedule Individual non-mandatory activities Flexible schedule & location TPAC 2015 Systems Analysis Group
Day Segments & Allocation Prioritized activities & tours: Form pegs in the daily schedule Pegs divide the day into 3 distinctive segments: Type 1: portion between prioritized tours Type 2: outbound/inbound legs of prioritized tours Type 3: At-work TPAC 2015 Systems Analysis Group
Day Segments Daily TimeLine [2] [0] [1] [3] [4] [6] H DO Mandatory PU Joint H 0-1 1-2 2-3 3-4 4-6 Type 1 Day Segments TPAC 2015 Systems Analysis Group
Day Segments cont.. Daily TimeLine [2] [0] [1] [3] [4] H DO Mandatory PU Joint H Outbound Leg DO Inbound Leg Type 2: t2_1o Type 2: t2_1i TPAC 2015 Systems Analysis Group
Day Segment cont.. Daily TimeLine [2] [0] [1] [3] [4] H DO Mandatory PU Joint H Business Chain : B-W-B Outbound Leg B1 WP B2 Inbound Leg Type 2: t2_2o Type 3: t3_221b, t3_221w, t3_221a Type 2: t2_2i TPAC 2015 Systems Analysis Group
Allocation Modeled person allocates non-mandatory activities to the available day segments Example - 1 workplace activity & 1 individual shopping activity Work Tour/Mandatory Peg Outbound Leg Inbound Leg Day Schedule H H W H H Available Day Segments for allocation of shopping activity 1st Type 1 Segment Type 2 segment Type 2 segment 2nd Type 1 Segment Type 3 segment TPAC 2015 Systems Analysis Group
Activity Allocation to Day Segments Factors governing segment choice Preference or Convenience Sequencing relative to pegs Work flexibility Schedule Constraints Time window availability Clustering of activities Spatial Accessibilities Accessibility to attractions from the peg anchor points TPAC 2015 Systems Analysis Group
Tour Formation Implemented for each day segment separately Entire day integrity is ensured by allocation model Type 1: Generates home-based tours. Single activity single destination tour Type 2: Single activity w/o prioritized activity additional stop on existing tour Type 3: Single activity w/o prioritized activity separate at-work subtour TPAC 2015 Systems Analysis Group
Tour Formation cont.. Multiple activities 3 decisions are modeled: 1. Sequencing of activities (along with prioritized activities for type 2 & 3 segments) 2. Location of activities 3. Tour structure single or multiple tours/additional stops at home TPAC 2015 Systems Analysis Group
Tour Formation Model Simultaneous model for sequence, location and tour structure of activities Tour frequency and stop frequency emerge from modeled choices Rank Ordered Logit based framework Choice set: union of location alternatives for all activities with option for tour break at home TPAC 2015 Systems Analysis Group
Tour Formation Example 1 shopping (S) and 1 maintenance (M) activity allocated to a Type 1 segment Possible tour formation scenarios: H S M H Single Tour H M S H H S H M H Two Tours H M H S H TPAC 2015 Systems Analysis Group
Tour Formation Choice Sequence S1 S2 S3 H M1 M2 M3 TPAC 2015 Systems Analysis Group
Tour Formation Choice Sequence (2) H M1 H M2 H S3 M3 H H M1 M2 M3 TPAC 2015 Systems Analysis Group
Tour Formation Choice Sequence (3) H M2 S3 H H H S3 H H M2 Shopping (3rd location) before maintenance (2nd location) & Two Tours TPAC 2015 Systems Analysis Group
Tour Formation Model Components Time-Space Constraints Sampling of Alternatives Utility Components Activity Sequence Activity Clustering Location Size Variables Impedance Tour Break at Home TPAC 2015 Systems Analysis Group
Utility Components & Underlying Behavioral Factors Activity Sequence Certain activities tend to be early/later than others Activity Clustering Certain activities tend to be implemented back to back Location Size Variables Zones with more attractions are visited more frequently Impedance All else being equal, travelers minimize time Tour Break at Home Stop at home is convenient if does not result in a big detour TPAC 2015 Systems Analysis Group
Model Application Examples Applied to randomly chosen sample of 4,400 HHs from the synthetic population Compared to 4,400 HHs available from NHTS 2008 TPAC 2015 Systems Analysis Group
Model Application: Non-Mandatory Tour Frequency Workers & University Students (>1 Non-mandatory Tours versus mandatory peg) 100.0% 90.0% 80.0% 70.0% 60.0% 1 Tour 50.0% 2 Tours 40.0% 3+ Tours 30.0% 20.0% 10.0% 0.0% Survey: No mandatory peg Model: No mandatory peg Survey: before mandatory Model: before mandatory Survey: after mandatory Model: after mandatory TPAC 2015 Systems Analysis Group
Model Application: Pair-wise Activity Sequencing (Type 1) Later Activity Purpose eat out breakfast Earlier Activity Purpose school escort non-sch escort eat out lunch eat out dinner visiting disc shop main school escort non-school escort shop maintenance eat out breakfast eat out lunch eat out dinner visiting discretionary 51.1% 46.2% 36.0% 36.4% 11.2% 29.0% 46.7% 49.4% 61.3% 100.0% 67.9% 84.5% 90.4% 100.0% 100.0% 60.8% 59.2% 69.2% 95.0% 69.8% 35.5% 44.1% 37.8% 52.7% 76.9% 44.7% 23.7% 47.9% Survey 48.9% 53.8% 63.6% 53.3% 32.1% 39.2% 55.9% 64.0% 88.8% 50.6% 15.5% 40.8% 62.2% 71.0% 38.7% 9.6% 30.8% 47.3% 0.0% 0.0% 5.0% 23.1% 0.0% 30.2% 55.3% 64.5% 76.3% 52.1% Later Activity Purpose eat out breakfast Earlier Activity Purpose school escort non-sch esc eat out lunch eat out dinner visiting disc shop main school escort non-school escort shop maintenance eat out breakfast eat out lunch eat out dinner visiting discretionary 43.2% 46.2% 52.2% 50.0% 57.8% 42.3% 58.6% 70.5% 68.8% 100.0% 57.7% 75.0% 85.7% 100.0% 100.0% 72.3% 84.8% 78.5% 80.0% 70.1% 38.1% 56.2% 60.2% 61.2% 62.2% 45.0% 13.9% 26.3% Model 56.8% 53.8% 50.0% 41.4% 42.3% 27.7% 43.8% 47.8% 42.2% 29.5% 25.0% 15.2% 39.8% 57.7% 31.2% 14.3% 21.5% 38.8% 0.0% 0.0% 20.0% 37.8% 0.0% 29.9% 55.0% 61.9% 86.1% 73.7% TPAC 2015 Systems Analysis Group
Example of Sequencing Priority Breakfast Activity Sequencing (No Mandatory Peg) 120.0% 100.0% 80.0% Percent 60.0% Survey 40.0% Model 20.0% 0.0% Activities after Breakfast TPAC 2015 Systems Analysis Group
Model Application: Activity Clustering Activities in Type 1 Segments after Mandatory Peg Survey Model Activity School Escort Other Escort Shopping Maintenance Breakfast Lunch Dinner Visiting Discretionary Total # pairs Clustered PairsTotal # pairs Clustered Pairs 0 0.0% 67 50.7% 44 61.4% 35 51.4% 0 0.0% 0 0.0% 8 100.0% 12 66.7% 55 74.5% 0 0.0% 60.0% 85.7% 72.7% 0.0% 0.0% 0.0% 80.8% 75.3% 55 7 11 0 1 0 26 146 TPAC 2015 Systems Analysis Group
Model Application: Average Tour Distance Individual Non-Mandatory Tours Type I Day Segment Average Round Dist (miles) Survey 11.3 18.6 23.6 35.8 8.5 15.0 21.0 30.7 8.6 15.2 18.1 29.7 Person Type # Destinations 1 2 3 4+ 1 2 3 4+ 1 2 3 4+ Model 8.0 13.0 18.0 25.0 8.0 13.0 19.0 28.0 7.0 13.0 17.0 17.0 Workers & University Students Non-workers & Retirees Children TPAC 2015 Systems Analysis Group
Conclusions activity is the basic unit of analysis in ABMs Travel is outcome of necessity to partake in activities under spatial and temporal constraints Modeling framework accounts for major decision parameters in a coherent way Important effects like trip chaining and activity sequencing are captured Behaviorally realistic design ensures higher sensitivity towards policies but further testing is planned TPAC 2015 Systems Analysis Group
Thank You! TPAC 2015 Systems Analysis Group


")
")