Insightful Data Visualizations on Various Trends
Explore captivating charts depicting how teenagers spend their time, the growth of the US yogurt market, wine customer segmentation, meat consumption by country, and the distribution of the world's largest unicorns by value across different nations.

Download Presentation

Please find below an Image/Link to download the presentation.
The content on the website is provided AS IS for your information and personal use only. It may not be sold, licensed, or shared on other websites without obtaining consent from the author. If you encounter any issues during the download, it is possible that the publisher has removed the file from their server.
You are allowed to download the files provided on this website for personal or commercial use, subject to the condition that they are used lawfully. All files are the property of their respective owners.
The content on the website is provided AS IS for your information and personal use only. It may not be sold, licensed, or shared on other websites without obtaining consent from the author.
E N D
Presentation Transcript
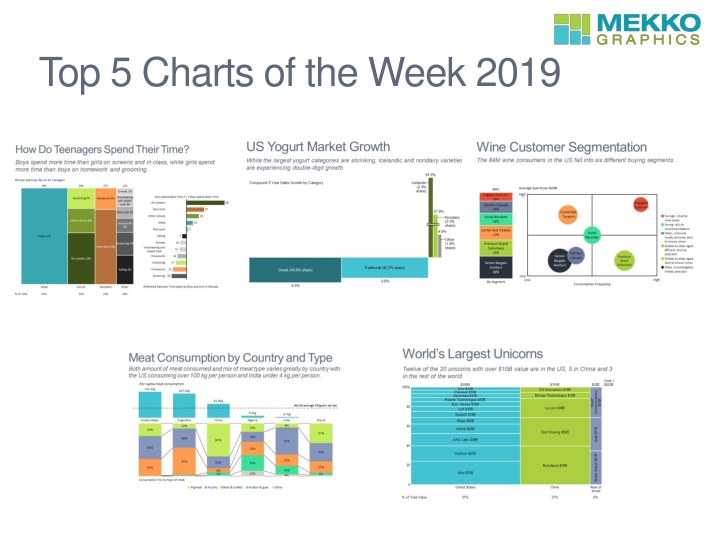
How Do Teenagers Spend Their Time? Boys spend more time than girls on screens and in class, while girls spend more time than boys on homework and grooming. Source: Pew Research Learn how to make this chart
US Yogurt Market Growth While the largest yogurt categories are shrinking, Icelandic and nondairy varieties are experiencing double-digit growth. Source: Nielsen as reported in Wall Street Journal Learn how to make this chart
Wine Customer Segmentation The 84M wine consumers in the US fall into six different buying segments. Source: Wine Intelligence US Portraits 2018 Learn how to make this chart
Meat Consumption by Country and Type Both amount of meat consumed and mix of meat type varies greatly by country with the US consuming over 100 kg per person and India under 4 kg per person. Source: Food and Agriculture Organization of the United Nations (FAO) as reported in Our World of Data Learn how to make this chart
Worlds Largest Unicorns Twelve of the 20 unicorns with over $10B value are in the US, 5 in China and 3 in the rest of the world. Source: CB Insights Learn how to make this chart