Insightful Regional Population Trends in Central Oregon
Explore comprehensive data on demographic shifts, income patterns, education levels, housing statistics, and transportation trends in Central Oregon. Delve into historic population changes, forecasted growth, and regional variations to gain valuable insights.

Download Presentation

Please find below an Image/Link to download the presentation.
The content on the website is provided AS IS for your information and personal use only. It may not be sold, licensed, or shared on other websites without obtaining consent from the author. If you encounter any issues during the download, it is possible that the publisher has removed the file from their server.
You are allowed to download the files provided on this website for personal or commercial use, subject to the condition that they are used lawfully. All files are the property of their respective owners.
The content on the website is provided AS IS for your information and personal use only. It may not be sold, licensed, or shared on other websites without obtaining consent from the author.
E N D
Presentation Transcript
Table of Contents 1. Demographics 2. Income and Employment 3. Education 4. Housing 5. Transportation not ready yet
1. Demographics 1. Current County Population 2. Historic County Population, 1990-2022 1. Historic Annual % Change in Population, 1991-2022 3. Forecast County Population, 2025-2070 1. Forecast County Annual % Change, 2025-2070 4. County Age Distribution, 2010, 2015, 2020 1. Regional Age Distribution 10yr % Change 5. County 20yr Population Change by Race and Ethnicity, 2000-2020
1. Current Regional Population 1. Current Regional Population Population Estimates for Oregon & Counties Certified Population Estimate July 1, 2022 Revised Population Estimate July 1, 2021 Population Change 2021- 2022 Percent Change 2021- 2022 Oregon 4,281,851 4,263,581 18,270 0.43% CROOK DESCHUTES JEFFERSON 26,162 207,561 25,404 25,595 203,916 25,032 567 3,645 372 2.21% 1.79% 1.49% Prepared by Population Research Center College of Urban and Public Affairs, Portland State University * Updated during the second review period (December 15 -March 31, 2023) December 15, 2022
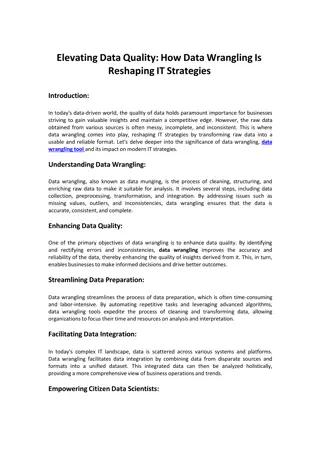
2. Historic Regional Population, 1990 2. Historic Regional Population, 1990- -2022 2022 Historic County Population: 1990-2022 Source: Population Research Center, PSU, April 2023 300,000 250,000 200,000 150,000 100,000 50,000 0 1990 1991 1992 1993 1994 1995 1996 1997 1998 1999 2000 2001 2002 2003 2004 2005 2006 2007 2008 2009 2010 2011 2012 2013 2014 2015 2016 2017 2018 2019 2020 2021 2022 Crook County Deschutes County Jefferson County Region Summary: Central Oregon has experienced consistent ongoing population growth. There was a general softening of the growth rate after the 2008 Recession and a recent increase over the pandemic years.
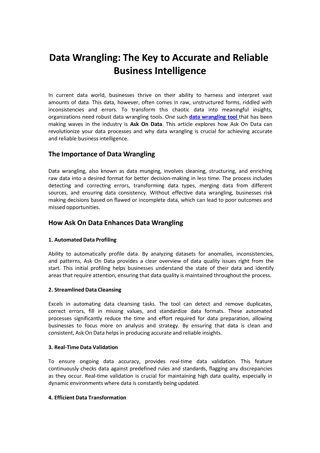
2.1 Historic Annual % Change in Population, 1991 2.1 Historic Annual % Change in Population, 1991- -2022 2022 Historic Population Annual % Change: 1990-2022 Source: Population Research Center, PSU, April 2023 10.00% 8.00% 6.00% 4.00% 2.00% 0.00% 1990 1991 1992 1993 1994 1995 1996 1997 1998 1999 2000 2001 2002 2003 2004 2005 2006 2007 2008 2009 2010 2011 2012 2013 2014 2015 2016 2017 2018 2019 2020 2021 2022 -2.00% -4.00% Crook % Change Deschutes % Change Jefferson % Change Regional % Change Oregon % Change Summary: Regional population growth has outpaced state growth for all years except 2011. Major regional growth periods during pre-2008 recession years and the pandemic. Deschutes County has consistent high growth rates. Some volatility in both Jefferson and Crook County change. Crook saw population decline years 2001-2004, and 2009-2012. Jefferson saw population decline in 2011.
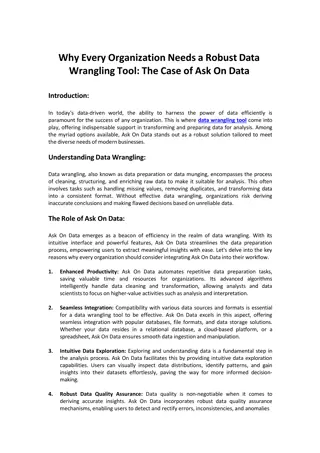
3. Forecast Regional Population, 2025 3. Forecast Regional Population, 2025- -2070 2070 3.1 Forecast County Populations 5yr % Change 3.1 Forecast County Populations 5yr % Change Forecast County Populations 5yr % Change: 2025-2070 Source: Population Research Center, Portland State University, June 30, 2022 Forecast County Populations: 2025-2070 Source: Population Research Center, Portland State University, June 30, 2022 500,000 10% 450,000 9% 400,000 8% 350,000 7% 300,000 6% 250,000 5% 200,000 4% 150,000 3% 100,000 2% 50,000 1% 0 0% 2025 2030 2035 2040 2045 2050 2055 2060 2065 2070 2025 2030 2035 2040 2045 2050 2055 2060 2065 2070 Crook County Deschutes County Jefferson County Region Crook County Deschutes County Jefferson County Region Consistent linear population growth for all three counties. Populations forecast to nearly double in 45 years. Higher rates of change in the first 10 to 15 years of forecast. Rates of change slow and remain consistent 2050 to 2070 for all three counties.
4. County Age Distribution, 2010, 2015, 2020 4. County Age Distribution, 2010, 2015, 2020 Source: Table S0101, American Community Survey 5-Year Estimates, 2020 Crook County 2015 Deschutes County 2015 Jefferson County 2015 Year Total County Population Age 0 to 19 20-44 45-64 65-85+ 2010 2010 2020 2010 2020 2020 20,987 Total Pop 5,037 5,331 6,443 4,218 21,085 157,733 170,740 197,015 21,720 Total Pop 27.9% 29.0% 27.6% 15.3% 22,445 24,105 23,440 Total Pop 21.1% 26.4% 27.7% 24.9% % Pop 24.0% 25.4% 30.7% 20.1% % Pop 21.9% 24.7% 29.9% 23.5% % Pop % Pop 23.8% 30.6% 28.3% 17.4% Total Pop 37,540 48,266 44,638 27,446 % Pop 25.2% 31.5% 28.5% 14.9% Total Pop 43,026 53,783 48,661 25,440 % Pop 21.9% 31.6% 26.7% 20.0% Total Pop % Pop 43,146 62,257 52,603 39,403 % Pop 27.3% 28.7% 27.2% 17.0% Total Pop 6,127 6,442 6,105 3,816 % Pop 24.9% 29.7% 26.1% 19.2% Total Pop 6,002 7,159 6,291 4,628 Total Pop 4,618 5,208 6,304 4,955 6,060 6,299 5,995 3,323 4,946 6,188 6,493 5,837 County Age Distribution - Population 10yr % Change 2010-2020 Age 0 to 19 20-44 45-64 65-85+ Crook Deschutes Jefferson -1.8% 16.1% 0.8% 38.4% 14.9% 29.0% 17.8% 43.6% -1.0% 13.7% 4.9% 39.3% In all three counties, the population of retirees is outpacing the growth of any other age group. Crook and Jefferson show a decline in youth aged 0-19. Prime work population 20-44 growing faster in Deschutes than Crook and Jefferson.
5. County 20yr Population Change by Race and Ethnicity, 2000-2020 Source: Table B03002, American Community Survey 5-Year Estimates, 2020 20yr % Change in Population by Race Group: 2020-2000 Crook County Deschutes County Jefferson County Region Oregon U.S. White Black or African American American Indian and Alaska Native Asian or Pacific Islander Hispanic or Latino (of any race) 23.9% 312.5% -12.4% 56.8% 68.9% 61.3% 395.5% 39.3% 142.3% 260.6% 27.2% 258.0% 18.7% 37.4% 45.5% 53.4% 368.6% 21.5% 126.3% 154.1% 16.5% 42.1% 1.0% 86.8% 100.6% 8.7% 19.0% 8.6% 78.9% 68.1% 20yr Numeric Change in Population by Race Group: 2020-2000 Crook County Deschutes County Jefferson County Region Oregon U.S. 5,119 81,363 67,092 6,424 92,906 74,906 1,032 754,947 487,458 23,455 45,147,402 18,500,387 6,569,194 212,658 8,391,208 8,883,426 Total Population Change White Black or African American American Indian and Alaska Native Asian or Pacific Islander Hispanic or Latino (of any race) 4,253 3,561 129 556 25 -31 50 365 878 376 1,329 3,802 901 1,416 4,879 472 37 94,920 102,217 712 Summary: Throughout Central Oregon, each race group saw a larger percentage change than both Oregon and the U.S. The population % change of Black or African American residents in all three counties saw the highest growth, followed by Hispanic or Latino and Asian or Pacific Islander. Only Crook County saw a decline, in the American Indian and Alaska Native race group.
2. Income and Employment 1. Central Oregon Industry Composition, 1990-2023 2. Difference in Industry Employment Index from Total Nonfarm Employment Index, 1990-2023 3. Private Sector Employment by Size of Establishment, 2001-2021 1. Temporal Trends in Private Sector Employment by Size of Establishment, 2001-2021 4. Central Oregon Employment by Age, 2005-2022 5. Central Oregon Median Household Income, 2015-2021 6. Central Oregon Average Annual Unemployment Rates, 2000-2022 7. Central Oregon Youth Unemployment: Age 20-24, 2010-2021 8. Central Oregon Industry Employment Projections, 2021-2031 9. Central Oregon % Below Poverty Level, 2012-2021
1. Central Oregon Industry Composition, 1990-2023 Source: Nicole Ramos, Central Oregon Regional Economist, 2023 100% 90% 80% Natural Resources, Construction, and 70% 60% 50% Professional, Health, 40% 30% 20% Trades and Tourism 10% 0% 1990 1995 2000 2005 2010 2015 2020 Temporal trends in central Oregon's industry composition continue to demonstrate a shift from natural resources, construction, and manufacturing toward professional, health, financial and information firms with trades and tourism staying roughly consistent in the past 31 years.
2. Difference in Industry Employment Index from Total Nonfarm Employment Index, 1990 2. Difference in Industry Employment Index from Total Nonfarm Employment Index, 1990- -2023 2023 Source: Nicole Ramos, Central Oregon Regional Economist, 2023 Professional and business services Education and health services Information Mining, logging, and construction Wholesale trade Transportation, warehousing, and Total Private Industry growth exceeded total covered nonfarm Leisure and hospitality Total Covered Financial activities Industry growth did not keep pace with total covered nonfarm growth Retail trade Government Manufacturing -1.5 -1 -0.5 0 0.5 1 1.5 2 2.5 3 3.5 Central Oregon's 2021 industry employment index demonstrates above average growth in professional and business services and educational and health services since 1990, with growth far below average for the manufacturing industry.
3. Private Sector Employment by Size of Establishment, 2001 3. Private Sector Employment by Size of Establishment, 2001- -2021 2021 Source: Nicole Ramos, Central Oregon Regional Economist, 2023 Percentage of Employees in Each Size Class Firm Size (Number of Employees) 5-9 10-19 9.8% 12.9% Total Year, Area Employees in All Size Classes 1,331,188 0 1-4 7.6% 20-49 18.9% 50-99 13.8% 100-249 15.7% 250-500 8.0% 500 + 13.3% Oregon Deschutes County Crook County Jefferson County Oregon Deschutes County Crook County Jefferson County 0.0% 44,062 4,844 0.0% 0.0% 10.6% 10.7% 13.1% 10.6% 16.5% 12.1% 21.9% 17.1% 13.3% 8.9% 12.8% 8.4% 4.3% 32.3% 7.4% 2001 * 3,738 0.0% 0.0% 9.7% 8.7% 14.9% 9.9% 16.6% 13.8% 20.6% 19.9% 38.2% 12.6% * * * 1,515,708 14.5% 7.9% 12.7% 64,146 4,641 0.0% 0.0% 12.2% 10.6% 12.2% 13.9% 17.0% 15.6% 25.0% 20.1% 10.3% 11.1% 11.5% 28.7% 11.7% * - 2022 * 4,103 0.0% 12.6% 15.8% 13.7% 22.2% 6.1% 29.5% * * Deschutes County employment has a healthy distribution amongst establishment sizes. Establishments with 20 to 49 employees have the largest share of county-wide employment (25.0%), followed by establishments with 10 to 19 employees (17.0%). Non-confidential employment in both Crook and Jefferson counties is primarily concentrated in small-to-medium-sized establishments with the largest share of employment taking place in medium-sized establishments that employ anywhere from 100 to 249 individuals (28.7% and 29.5% respectively), and the second largest share of employment taking place in establishments that have anywhere from 20 to 49 employees (20.1 and 22.2% respectively). Otherwise, employment is somewhat similarly distributed among firm sizes.
3.1 Temporal Trends in Private Sector Employment by Size of Establishment, 2001 3.1 Temporal Trends in Private Sector Employment by Size of Establishment, 2001- -2021 2021 Source: Nicole Ramos, Central Oregon Regional Economist, 2023 Percentage Point Change, 2001 - 2022 Firm Size (Number of Employees) 5-9 10-19 0.1% 0.9% -1.0% 0.5% 3.4% 3.5% 0.9% -2.8% Area 0 1-4 1.1% 1.6% -0.1% 2.9% 20-49 1.1% 3.2% 3.1% 1.6% 50-99 -1.2% -2.9% 2.2% -32.2% 100-249 -1.3% -1.3% 20.3% 250-500 -0.1% 7.4% 500 + -0.7% Oregon Deschutes County Crook County Jefferson County 0.0% 0.0% 0.0% 0.0% * - * * * * Trends generally favor small-to-medium sized firms in Central Oregon, with general decreases in mid-to-large-sized firms. Changes from 2011 were, for the most part, moderate in both directions across Central Oregon. However, there was notable employment growth (+7.4%) among firms with 250 to 500 employees in Deschutes County and among firms with 100 to 249 employees in Crook County (+20.3%). Also of note, a similar but more extreme downward change has occurred in Jefferson County among firms with 50 to 99 employees (-32.2%).
4. 4. Central Oregon Employment by Age, 2005 Central Oregon Employment by Age, 2005- -2022 2022 Source: Nicole Ramos, Central Oregon Regional Economist, 2023 less than 25 25-44 45 and older 1.5 1.4 1.3 1.2 1.1 1 0.9 0.8 0.7 *employment indexed to 2005 0.6 2005 Q2 2005 Q3 2005 Q4 2006 Q1 2006 Q2 2006 Q3 2006 Q4 2007 Q1 2007 Q2 2007 Q3 2007 Q4 2008 Q1 2008 Q2 2008 Q3 2008 Q4 2009 Q1 2009 Q2 2009 Q3 2009 Q4 2010 Q1 2010 Q2 2010 Q3 2010 Q4 2011 Q1 2011 Q2 2011 Q3 2011 Q4 2012 Q1 2012 Q2 2012 Q3 2012 Q4 2013 Q1 2013 Q2 2013 Q3 2013 Q4 2014 Q1 2014 Q2 2014 Q3 2014 Q4 2015 Q1 2015 Q2 2015 Q3 2015 Q4 2016 Q1 2016 Q2 2016 Q3 2016 Q4 2017 Q1 2017 Q2 2017 Q3 2017 Q4 2018 Q1 2018 Q2 2018 Q3 2018 Q4 2019 Q1 2019 Q2 2019 Q3 2019 Q4 2020 Q1 2020 Q2 2020 Q3 2020 Q4 2021 Q1 2021 Q2 2021 Q3 2021 Q4 2022 Q1 2022 Q2 During the COVID-19 pandemic recession, employment dropped for all age groups but recovered quickly compared to employment losses experienced during the great recession. Unlike the great recession, however, young adult employment recovered at roughly the same rate as that of older workers. During the great recession, the magnitude of employment losses represented a much larger portion of young adult employment compared to their older counterparts, while during the COVID-19 recession, young adult employment experienced a slightly higher downward change in employment with a strong recovery rate.
5. 5. Central Oregon Median Household Income, 2015 Central Oregon Median Household Income, 2015- -2021 2021 Source: US Census Bureau, Table S1901, American Community Survey 5yr Estimates Central Oregon Median Household Income 2015-2021 $80,000 Crook $49,191 $46,059 $45,004 $40,263 $38,795 $36,158 $37,106 $39,583 $41,777 $44,524 $49,006 $59,000 $64,820 Deschutes $58,504 $53,071 $52,962 $51,468 $50,209 $49,584 $51,223 $54,211 $59,152 $63,680 $67,043 $68,937 $74,082 Jefferson $50,124 $41,425 $42,867 $43,330 $43,373 $46,588 $46,366 $47,063 $48,464 $50,339 $53,277 $55,844 $59,748 Oregon $57,202 $49,260 $49,850 $50,036 $50,229 $50,521 $51,243 $53,270 $56,119 $59,393 $62,818 $65,667 $70,084 2000 2010 2011 2012 2013 2014 2015 2016 2017 2018 2019 2020 2021 $70,000 $60,000 $50,000 $40,000 $30,000 $20,000 $10,000 $0 2015 2016 2017 2018 2019 2020 2021 Crook Deschutes Jefferson Oregon Summary: Median Household Income for Deschutes County is consistently above the state median. Crook had a significant increase during the pandemic years.
6. 6. Central Oregon Average Annual Unemployment Rates, 2000 Central Oregon Average Annual Unemployment Rates, 2000- -2022 2022 Source: Oregon Employment Department, Local Area Unemployment, 2023 Central Oregon Annual Average Unemployment Rates, 2000-2022 20% 18% 16% 14% 12% 10% 8% 6% 4% 2% 0% 2000 2001 2002 2003 2004 2005 2006 2007 2008 2009 2010 2011 2012 2013 2014 2015 2016 2017 2018 2019 2020 2021 2022 US Oregon Crook County Deschutes County Jefferson County Summary: Central Oregon has almost fully rebound to pre- pandemic unemployment levels. Crook and Jefferson County have higher unemployment than Deschutes, the state, and the US, while Deschutes has unemployment rates near equal to Oregon, but still slightly higher than the US.
7. Central Oregon Youth Unemployment: Age 20 7. Central Oregon Youth Unemployment: Age 20- -24, 2010 24, 2010- -2021 2021 Source: US Census Bureau, Table S2301, American Community Survey 5-Year Estimates Central Oregon Youth Unemployment: Age 20-24, 2010-2021 45.0% 40.0% 35.0% 30.0% Percent Unemployed 25.0% 20.0% 15.0% 10.0% 5.0% 0.0% 2010 2011 2012 2013 2014 2015 2016 2017 2018 2019 2020 2021 Crook County Deschutes County Jefferson County Oregon Summary: Youth Unemployment in Central Oregon is highly elastic. There's a lot of year-to-year variation. Jefferson County is seeing an increase in youth unemployment on par with 2016 levels. Crook County saw a decrease from 42% to 3% youth unemployment in a 7-year period. Deschutes County has remained steady, with a slight increase during the pandemic years.
8. Central Oregon Industry Employment Projections, 2021 8. Central Oregon Industry Employment Projections, 2021- -2031 2031 Source: Oregon Employment Department, Sarah Cunningham Projections Economist, 2023 2021 2031 Change % Change Total employment 108,440 125,240 16,800 15% Total payroll employment 101,790 118,100 16,310 16% Total private 88,510 104,200 15,690 18% To produce statewide and regional industry projections we use a combination of national historical and projected employment, Oregon and regional historical industry employment, population growth including various demographic breakouts (0-4, prime working age, 65+), housing starts, personal income, labor force participation, historical unemployment rates, and more national and area- specific variables as inputs into statistical models. After industry projections are modeled, a degree of analyst judgement is incorporated. Natural resources and mining 1,600 1,750 150 9% Construction 8,500 10,190 1,690 20% Manufacturing 7,620 8,740 1,120 15% Trade, transportation, and utilities 18,370 20,000 1,630 9% Information 2,080 2,390 310 15% Financial activities 5,860 6,240 380 6% Leisure and hospitality was greatly affected by the Pandemic Recession. The Central Oregon area s leisure and hospitality industry experienced an 18% loss of employment (-2,730 jobs) between 2019 and 2020. By 2021, the industry had only regained 42% of the jobs lost in 2020. This means that the 2021-2031 projection for leisure and hospitality began during a period of economy recovery, and about one-third of the projected job gains between 2021 and 2031 can be attributed to recovery. A similar pattern is projected at the statewide level as well. Professional and business services 10,950 13,100 2,150 20% Private educational and health services 16,430 19,180 2,750 17% Health care and social assistance 15,240 17,800 2,560 17% Leisure and hospitality 13,430 18,300 4,870 36% Other services 3,670 4,310 640 17% Government 13,280 13,900 620 5% Federal government 1,380 1,400 20 1% State government 1,380 1,450 70 5% Local government 10,520 11,050 530 5% Self-employment 6,650 7,140 490 7%
9. Central Oregon % Below Poverty Level, 2012 9. Central Oregon % Below Poverty Level, 2012- -2021 2021 Source: US Census Bureau, Table S1701 Poverty Status in the Past 12 Months, American Community Survey, 5-year Estimates Central Oregon % Below Poverty Level, 2012-2021 25.0% 20.0% 15.0% 10.0% 5.0% 0.0% 2012 2013 2014 2015 2016 2017 2018 2019 2020 2021 Crook County Deschutes County Jefferson County Oregon Summary: Regional improvement in poverty levels since 2014. Crook and Jefferson Counties showing significant improvement. Deschutes County steadily improving.
3. Education 1. School District Performance: State Assessment, 2014-2022 Science 2. English/Language Arts 3. Math 4. Educational Attainment by County, Age >25, 2010, 2015, 2020 1. Educational Attainment by County by Race Group, 2015, 2020
1. School District Performance: State Assessment, 2014 1. School District Performance: State Assessment, 2014- -2022 2022 - - Science Science Source: Oregon Department of Education: State Assessment Group Reports, 2023 School District Performance: State Assesment Yearly Trends 100 90 80 70 % Students Proficient (3 or 4) 60 Bend-LaPine Administrative SD 1 Crook County SD Culver SD 4 50 Jefferson County SD 509J Redmond SD 2J Sisters SD 6 40 State 30 20 10 0 2014-2015 2015-2016 2016-2017 2017-2018 2018-2019 2021-2022 Science
2. School District Performance: State Assessment, 2014 2. School District Performance: State Assessment, 2014- -2022 2022 English/Language Arts English/Language Arts Source: Oregon Department of Education: State Assessment Group Reports, 2023 School District Performance: State Assesment Yearly Trends 80 70 60 50 % Students Proficient (3 or 4) Bend-LaPine Administrative SD 1 Crook County SD Culver SD 4 40 Jefferson County SD 509J Redmond SD 2J Sisters SD 6 30 State 20 10 0 2014-2015 2015-2016 2016-2017 2017-2018 2018-2019 2021-2022 ELA
3. School District Performance: State Assessment, 2014 3. School District Performance: State Assessment, 2014- -2022 2022 Math Math Source: Oregon Department of Education: State Assessment Group Reports, 2023 School District Performance: State Assesment Yearly Trends 60 50 40 Across Central Oregon and the state, the percentage of students scoring proficient (a 3 or 4 out of 4) on their state assessment has dropped significantly since before the pandemic. Note that scores were not available for 2020-2021, as the state assessments were not required and were left up to each district to administer. % Students Proficient (3 or 4) Bend-LaPine Administrative SD 1 Crook County SD Culver SD 4 30 Jefferson County SD 509J Redmond SD 2J Sisters SD 6 State 20 10 0 2014-2015 2015-2016 2016-2017 2017-2018 2018-2019 2021-2022 Math
4. Educational Attainment by County, Age >25, 2010, 2015, 2020 4. Educational Attainment by County, Age >25, 2010, 2015, 2020 Source: Table S1501 Educational Attainment, American Community Survey 5yr Estimates, 2023 Educational Attainment Population <25yo 100% 90% 80% In all three counties, the educational attainment levels of the population are increasing. The proportion of the population with a high-school graduation or equivalent or less either remained the same or decreased. There was a slight increase in Associate's degrees in Jefferson and Crook Counties (6% to 10% and 7% to 10%). The percentage of the population with Bachelor's degrees increased in Crook (10%-13%), Deschutes (19%-23%) and Jefferson (10%-14%). Graduate or professional degrees also increased in Deschutes (10%-14%) and Jefferson (5% - 7%). 70% Percent of Population <25yo Graduate or professional degree 60% Bachelor's degree Some college, no degree 50% Associate's degree 9th to 12th grade, no diploma 40% High school graduate (includes equivalency) Less than 9th grade 30% 20% 10% 0% 2010 2015 2020 2010 2015 2020 2010 2015 2020 2010 2015 2020 Crook Deschutes Jefferson Oregon
4.1 4.1 Educational Attainment by County by Race Group, 2015, 2020 Educational Attainment by County by Race Group, 2015, 2020 Crook Crook Source: Table S1501 Educational Attainment, American Community Survey 5yr Estimates, 2023 Please note for all counties this data was not available earlier than 2015. In Crook County, educational attainment is not evenly shared across race groups. The group Asian Alone has significantly higher rates of both High School or Higher or Bachelor's or higher. Both increased by 40% and 25% respectively. Educational attainment amongst the American Indian or Alaska Native group decreased significantly, both in High School or higher (+90% to 60%) and Bachelor's or higher (9% to 5%).
4.1 4.1 Educational Attainment by County by Race Group, 2015, 2020 Educational Attainment by County by Race Group, 2015, 2020 - - Deschutes Deschutes Source: Table S1501 Educational Attainment, American Community Survey 5yr Estimates, 2023 Please note for all counties this data was not available earlier than 2015. All race groups, except for Hispanic or Latino Origin and Some other race alone, saw an increase in high school graduate or higher levels of education. All groups except Black Alone, American Indian or Alaska Native, and Hispanic or Latino Origin saw an increase in Bachelor's degree or higher levels of education.
4.1 4.1 Educational Attainment by County by Race Group, 2015, 2020 Educational Attainment by County by Race Group, 2015, 2020 - - Jefferson Jefferson Source: Table S1501 Educational Attainment, American Community Survey 5yr Estimates, 2023 Please note for all counties this data was not available earlier than 2015. In all race groups except for American Indian or Alaska Native, Asian alone and Native Hawaiian and other Pacific Islander, there was an increase in the percent of the population with a bachelor's degree or higher. Asian alone had a significant decrease, from 70% to less than 30%, and Native Hawaiian and Other Pacific Islander from 15% to 0%. All race groups except Asian alone had an increase in high school graduate or higher.
4. Housing 1. Central Oregon Median Existing Single Family Sales Price, <1acre, 2015-2022 1. Annual % Change 2. Central Oregon Median Household Income vs Median Single Family Sales Price, 2015-2022 (by County)
1. Central Oregon Median Existing Single Family Sales Price, <1acre, 2015-2022 Source: Tyson Nivens, Central Oregon Association of Realtors, June 2023 2015 2016 2017 2018 2019 2020 2021 2022 Crook County Deschutes County $ 299,900 $ 332,000 $ 368,000 $ 390,000 $ 409,000 $ 445,000 $ 580,000 $ 658,625 Jefferson County $ 125,000 $ 142,900 $ 175,050 $ 215,000 $ 225,690 $ 255,000 $ 305,000 $ 363,937 $ 159,000 $ 185,000 $ 221,000 $ 235,250 $ 252,750 $ 299,900 $ 379,500 $ 403,220 Central Oregon Median Existing Single Family Sales Price <1acre, 2015-2022 Annual % Change Single Family Sales Price, 2016-2022 35.0% $700,000 30.0% $600,000 25.0% $500,000 20.0% $400,000 15.0% $300,000 10.0% $200,000 5.0% $100,000 0.0% $- 2016 2017 2018 2019 2020 2021 2022 2015 2016 2017 2018 2019 2020 2021 2022 Crook County Deschutes County Jefferson County Crook County Deschutes County Jefferson County
2. Central Oregon Median Household Income vs Median Single Family Sales Price, 2015 2. Central Oregon Median Household Income vs Median Single Family Sales Price, 2015- -2022 (by County) 2022 (by County) Source: Tyson Nivens, Central Oregon Association of Realtors, June 2023 & US Census Bureau, Table S1901, American Community Survey 5yr Estimates Crook Deschutes Jefferson Median Household Income Median Single Family Sales Price Median Household Income Median Single Family Sales Price Median Household Income Median Single Family Sales Price $37,106 $159,000 $51,223 $39,583 $185,000 $54,211 $41,777 $221,000 $59,152 $44,524 $235,250 $63,680 $49,006 $252,750 $67,043 $59,000 $299,900 $68,937 $64,820 $379,500 $74,082 2015 2016 2017 2018 2019 2020 2021 $299,900 $332,000 $368,000 $390,000 $409,000 $445,000 $580,000 $46,366 $47,063 $48,464 $50,339 $53,277 $55,844 $59,748 $125,000 $142,900 $175,050 $215,000 $225,690 $255,000 $305,000
2. Central Oregon Median Household Income vs Median Single Family Sales Price, 2015 2. Central Oregon Median Household Income vs Median Single Family Sales Price, 2015- -2022 2022 - - Crook Crook Source: Tyson Nivens, Central Oregon Association of Realtors, June 2023 & US Census Bureau, Table S1901, American Community Survey 5yr Estimates Crook County Median Household Income $37,106 $39,583 $41,777 $44,524 $49,006 $59,000 $64,820 Crook County Median Household Income, Median Single Family Sale Price, and Housing Affordability Index 2015-2021 Median Single Family Sales Price $ 159,000 $ 185,000 $ 221,000 $ 235,250 $ 252,750 $ 299,900 $ 379,500 Affordability Index 2015 2016 2017 2018 2019 2020 2021 4.2 4.6 5.2 5.2 5.1 5.0 5.8 $400,000 7 $350,000 6 $300,000 5 $250,000 4 Crook 6yr % Change Index $200,000 75% 139% 3 $150,000 Crook Annual % Change Median Household Income & Median Single Family Sales Price 2016-2021 2 $100,000 1 $50,000 30% $0 0 25% 2015 2016 2017 2018 2019 2020 2021 20% Median Household Income Median Single Family Sales Price Affordability Index 15% In Crook, Median single family sales prices are fast outpacing the growth of median household income. This has led to a rise in the affordability index, meaning housing is less affordable when comparing to median income. 10% 5% 0% 2016 2017 2018 2019 2020 2021 The % change of household income and single family sales price were growing at a similar rate in the pre-pandemic years, but 2021 saw a sharp increase in the % change of single family sales prices while household income rates fell to 2019 levels. % Change Median Household Income % Change Median Single Family Sales Price
2. Central Oregon Median Household Income vs Median Single Family Sales Price, 2015 2. Central Oregon Median Household Income vs Median Single Family Sales Price, 2015- -2022 2022 - - Deschutes Deschutes Source: Tyson Nivens, Central Oregon Association of Realtors, June 2023 & US Census Bureau, Table S1901, American Community Survey 5yr Estimates Deschutes Deschutes Median Household Income, Median Single Family Sale Price, and Housing Affordability Index 2015-2021 Median Household Income $51,223 $54,211 $59,152 $63,680 $67,043 $68,937 $74,082 Median Single Family Sales Price $ 299,900 $ 332,000 $ 368,000 $ 390,000 $ 409,000 $ 445,000 $ 580,000 Affordability Index 2015 2016 2017 2018 2019 2020 2021 5.9 6.1 6.2 6.1 6.1 6.5 7.8 $700,000 9.0 8.0 $600,000 7.0 $500,000 6.0 $400,000 5.0 Index 4.0 $300,000 6yr % Change 3.0 $200,000 45% 93% 2.0 $100,000 1.0 Deschutes Annual % Change Median Household Income & Median Single Family Sales Price 2016-2021 $0 0.0 2015 2016 2017 2018 2019 2020 2021 Median Household Income Median Single Family Sales Price Affordability Index 35.0% 30.0% 25.0% In Deschutes County, single family housing prices have fast outgrown the median household income, leading to an increase in the affordability index (a decrease in affordability). While both housing prices and median household income were growing at a similar rate in the pre-pandemic years, 2020 saw a significant change. Single family prices increased by 30% from 2020 to 2021, while median household income grew by 6%. 20.0% 15.0% 10.0% 5.0% 0.0% 2016 2017 2018 2019 2020 2021 % Change Median Household Income % Change Median Single Family Sales Price
2. Central Oregon Median Household Income vs Median Single Family Sales Price, 2015 2. Central Oregon Median Household Income vs Median Single Family Sales Price, 2015- -2022 2022 - - Jefferson Jefferson Source: Tyson Nivens, Central Oregon Association of Realtors, June 2023 & US Census Bureau, Table S1901, American Community Survey 5yr Estimates Jefferson Jefferson Median Household Income, Median Single Family Sale Price, and Housing Affordability Index 2015-2021 Median Household Income $46,366 $47,063 $48,464 $50,339 $53,277 $55,844 $59,748 Median Single Family Sales Price $ 125,000 $ 142,900 $ 175,050 $ 215,000 $ 225,690 $ 255,000 $ 305,000 Affordability Index $350,000 6.0 2015 2016 2017 2018 2019 2020 2021 2.7 3.0 3.6 4.3 4.2 4.6 5.1 $300,000 5.0 $250,000 4.0 $200,000 Index 3.0 $150,000 6yr % Change 2.0 29% 144% $100,000 1.0 Jefferson Annual % Change Median Household Income & Median Single Family Sales Price 2016-2021 $50,000 $0 0.0 25.0% 2015 2016 2017 2018 2019 2020 2021 Median Household Income Median Single Family Sales Price Affordability Index 20.0% 15.0% Historically in Jefferson County, even during the pre-pandemic years, the median single family sales price has grown significantly faster than median household income. This has led to a large increase in the affordability index. Except for 2019, the median single family sales price has grown between 10% and 15% more than the median household income. 10.0% 5.0% 0.0% 2016 2017 2018 2019 2020 2021 % Change Median Household Income % Change Median Single Family Sales Price