Insights from Inclusive Communities Household Survey March 2025
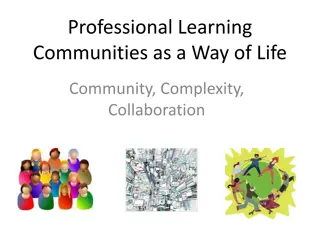
Gain valuable insights into residents' opinions and experiences in the West Midlands through the Inclusive Communities Household Survey conducted by WMCA. This survey aims to inform more inclusive decision-making, address data gaps, and reduce inequalities across the region. Explore the background, objectives, methodology, and demographic profile of 2,800 West Midlands residents aged 18+ in this comprehensive report.

Download Presentation

Please find below an Image/Link to download the presentation.
The content on the website is provided AS IS for your information and personal use only. It may not be sold, licensed, or shared on other websites without obtaining consent from the author. If you encounter any issues during the download, it is possible that the publisher has removed the file from their server.
You are allowed to download the files provided on this website for personal or commercial use, subject to the condition that they are used lawfully. All files are the property of their respective owners.
The content on the website is provided AS IS for your information and personal use only. It may not be sold, licensed, or shared on other websites without obtaining consent from the author.
E N D
Presentation Transcript
Inclusive Communities Household Survey Overall report March 2025
Background and Objectives The WMCA have commissioned this survey to gather insights into residents' opinions and experiences, enabling WMCA to make more informed, inclusive, and effective decisions. By understanding residents needs, WMCA can better ensure its policies are equitable, responsive to ever-changing needs, and foster greater trust, transparency, and regional cohesion. The Birmingham Commonwealth Games in 2022 did not utilise its entire budget allocation. The Department for Culture, Media and Sport (DCMS) agreed to return the unused funds to the region, in the form of a Legacy Fund, which aims to build on the community- based initiatives associated with the Games. Part of the funding has been allocated to the WMCA s Inclusive Communities programme. The aim of this programme is to strengthen ongoing work around social capital, social inclusion, social infrastructure and social mobility. This survey plays a key role in aligning decision-making with the long-term vision for the West Midlands, helping WMCA better understand the extent to which it shares a common understanding with residents and communities. Additionally, the WMCA Household Survey will address data gaps in existing regional and national datasets, providing valuable evidence at both the WMCA and local authority levels. The insights gained will help inform WMCA s approach to inclusion and other policy areas aimed at reducing inequalities across the region. Through this programme, WMCA have highlighted the need to find out more about communities in the West Midlands including how residents feel about belonging to their neighbourhood, the opportunities for themselves and their families, and what they would like to see improve in the future.
Methodology A quantitative survey was drafted by WMCA and reviewed collaboratively between WMCA and M E L Research. The survey was distributed to West Midlands residents, via two leading online access panel partners. Respondents self-completed the survey online. During fieldwork, quotas were set in each LA on gender, age, ethnicity and disability. Achievement on income and level of education were monitored. The 12-minute survey was programmed in-house by M E L Research. Data cleaning, processing and tabulation was undertaken internally by M E L Research. The data was then weighted to ensure results were representative of each LA. To ensure we reached a representative cross-section of West Midlands residents, interviews were also conducted face-to-face. Fieldwork took place between 24th January and 28th February 2025. Respondents approached by interviewers were asked to self-complete the survey on interviewers laptops, to ensure all data collected was comparable to that achieved online. Results were then analysed by M E L Research and findings are outlined in this report.
Demographic profile 2,800 West Midlands residents aged 18+ Survey Methodology by Local Authority Local Authority Birmingham Birmingham 90% 418 10% Coventry Coventry 90% 400 10% Dudley Dudley 79% 406 21% Sandwell Sandwell 62% 394 38% Solihull Solihull 66% 383 34% Walsall Walsall 69% 398 31% Wolverhampton Wolverhampton 75% 401 25% Online Face to face Unweighted sample base: 2800
Demographic profile 2,800 West Midlands residents aged 18+ 13% 11% 18% 18% 15% 17% 6% Ethnicity Age 67% 19% 9% 3% 1% 18 to 24 55 to 64 25 to 34 65 to 74 35 to 44 75+ 45 to 54 Prefer not to say White Asian Black Mixed Other/Prefer not to say Gender Disability 75% 45% 23% 55% 1% Male Female Yes No Prefer not to say Prefer to describe my gender in a different way and Prefer not to say were <0.5% each Unweighted sample base: 2800
Demographic profile Household Income Highest Level of Education Less than 10,000 7% No qualifications 10% 10,000 - 19,999 14% Level 1 and entry level 13% 20,000 - 29,999 17% Level 2 18% 30,000 - 39,999 13% Apprenticeship 2% 40,000 - 49,999 8% Level 3 19% 50,000 - 59,999 6% Level 4 36% 60,000 - 79,999 7% Prefer not to say 2% 80,000 - 99,999 4% 100,000 or more 4% Summary: Degree educated 36% Prefer not to say 14% Summary: Not degree educated 62% Don't know 6% Unweighted sample base: 2800. Please refer to detailed levels of education in appendix
Understanding the sample While the profile of the sample was controlled by the discrete variables of gender, age, ethnicity and disability, in reality, these variables are interconnected. For example, as shown in the table below, survey respondents who are in the younger age groups are more likely to be from minority ethnic groups and degree educated, and white respondents are more likely to be older and not degree educated. This report will provide analysis by different sub-groups, identifying where there are significant variations in opinion. However, such analysis is observational, and it does not necessarily mean that the identified differences are driven by that particular aspect of the respondent s identity. Not degree educated Disability Yes Disability No Degree educated Total Female Male 18-34 35-54 55+ Asian 19% 18% 21% +31% 21% -8% -11% +22% +25% -16% Black 9% -8% +10% +15% 10% -3% -5% +10% +13% -6% Mixed 3% +4% -2% +6% 3% -1% 3% 3% 3% 3% White 67% 68% 66% -46% -63% +88% +80% -64% -58% +73% Other 1% 1% 1% 1% +2% 0% *% 1% 1% 1% * denotes <0.5% Please note Other includes prefer not to say + denotes % significantly higher vs total at the 95% confidence level - denotes % significantly lower vs total at the 95% confidence level
Digital connectivity The majority of residents across the West Midlands are digitally confident Those who are not, are more likely to be older, to live alone and on a lower income, to not be in work, to have lower levels of educational attainment, to be white and living with a disability/ long-term health condition The most common digitally social activity is scrolling through social media, reading and interacting with content made by others Residents spend more than 8 hours a week, on average, doing this Younger people, those with higher household incomes are among the groups of people spending most time connected through digital platforms Males, older people, those living alone, not working and on lower incomes, spend less time digitally connected Those that spend more time connecting with people digitally, are more active across all social activities More than half (53%) feel positive about their time spent on social media Just 6% are negative about this Reasons for social media positivity include enjoyment, relaxation, to feel connected and to research topics Those negative about time spent on social media feel that it is unproductive/ wastes time and can be a depressing/sad experience
Social life The most common social activity is spending time with family and friends Almost two-thirds (65%) of residents feel positive about their social life, while 11% feel negative Positivity is linked to spending more time on social activities and having supportive relationships Those most positive are more likely to be male, younger, employed, from young families, with higher income and education, religious, from ethnic minorities, active in the community, and feel welcome and connected locally Negativity stems from social isolation, lack of outings, and difficulty maintaining friendships Those most negative are more likely to be female, live alone, not work, have lower income and education, be disabled, white, non-religious, less socially active, feel less connected, have limited support networks, and lower neighbourhood trust Lack of money is a key barrier While social activity is generally linked to greater satisfaction with social life, this is not always the case 56% of less socially active residents still feel positive Four in five (81%) want to improve their social life, predominantly through having more money Those feeling negative also want more confidence, alternative ways to meet people, and better access to suitable social spaces The desire for change is not limited to those dissatisfied with their social life young people, employed individuals, higher earners, parents, ethnic minorities, LGBTQ+ residents, and those already active in the community are also most likely to want to make changes to their social life
Social inclusion and participation Over half (57%) feel welcome and included in their community, with just 7% feeling unwelcome While 36% are active in their community, 41% are not People volunteer to give back, socialise, because they enjoy volunteering, and it gives them a purpose Lack of time is the biggest barrier to community participation Almost two in five (39%) feel connected to their community; 25% feel disconnected Over half (56%) want stronger community ties Not everyone who feels less connected to their community wants this to change Among those who do not feel connected to their local community, almost half (48%) do not want this to change The profile of those with different types of connection to their community varies Those already connected but wanting greater connection, are more likely to be younger, employed, religious males, living in family units, with higher income/education levels and from ethnic minorities Those disconnected but wanting change are often marginalised women (e.g. living alone, disabled, not working, bisexual) Those disconnected but happy with that are more likely to be older, white and not religious (potentially retired empty nesters) Most residents (72%) trust some people in their neighbourhood, matching the national benchmark 83% have someone to turn to for help, although this is lower than national figures
Social infrastructure and accessibility There is minority agreement among residents that the region offers groups, clubs and activities, jobs and a fulfilling life Around a quarter do not feel that their region offers these Those more positive about their social life, are more likely to feel the region offers them these opportunities Those most negative about their social life are less likely to see these opportunities Residents most commonly cite the people as the most special aspect of their area Good local amenities, green spaces and quiet/peaceful surroundings are the next most common reasons that residents feel their area is special
Almost nine in ten (89%) feel confident digitally Over six in ten (62%) are fully confident online, whilst a quarter (27%) occasionally encounter challenges Yes, I feel fully confident and able to access everything I need/want to 62% Yes, I feel somewhat confident although I encounter occasional challenges 27% Lower digital confidence No, I often struggle to access services or participate in activities online 6% Aged 55 plus Lives alone or with adult children Economically inactive Lower income White Living with a disability Lower educational attainment No, I am unable to use online technology for these activities 2% Not applicable I do not need to use online technology for these services 3% Don't know 1% 89% Digitally confident 8% Not digitally confident Q1. Do you feel that you can fully access services or participate in everyday activities using online technology, such as paying council tax and other bills online or doing online shopping? Unweighted sample base: 2800
Passive interaction on social media and video calling are the most common digitally social activities Under 35s and those living in households with 100,000k+ income are most digitally connected, on average Average 8.2 hours/week Average 2.6 hours/week 36% 69% 22% 19% 13% 8% 17% 7% 1% 1% 4% 2% 1% *% 0 hours 1-4 hours 5-9 hours 10-19 hours 20-49 hours 50 Don't know 0 hours 1-4 hours 5-9 hours 10-19 hours 20-49 hours 50 Don't know Scrolling through, reading and interacting with content made by other people on social media hours or more Gaming with friends hours or more Average 4.3 hours/week Average 2.2 hours/week 44% 61% 34% 27% 12% 6% 3% 6% 1% 1% 3% 2% 1% *% 0 hours 1-4 hours 5-9 hours 10-19 hours 20-49 hours 50 Don't know 0 hours 1-4 hours 5-9 hours 10-19 hours 20-49 hours 50 Don't know Video calling hours or more hours or more Creating your own content such as posts and videos for social media Q2. How many hours per week do you use each of the following as part of your digital social life? Unweighted sample base: 2800. * denotes <0.5%
Residents who do not have someone to rely on when they need help, spend more time consuming social media content Average hours per week 9.2 Digital social life: Non or light user Male Older Live alone Economically inactive Christian Lower educational attainment Lower income Heterosexual White Living with disability Not active in community More likely to feel: Negative about social life Disconnected from community 7.9 Scrolling social media Digital social life: Heavy user Has people to rely on (2308) Does not have people to rely on (492) Younger Economically active Live with children <18/ extended family Never married Higher income Bisexual Ethnic minority Higher educational attainment Active in community Very socially active Those without someone to rely on spend more time passively scrolling on social media perhaps due to having more time or seeking connection this way. It may be interesting to explore this in further research Q2. How many hours per week do you use each of the following as part of your digital social life? Based on all digitally social activities combined Unweighted sample bases range from 64 to 2121
Residents most socially active across all activities, are most likely to be most socially active online This includes video calling, gaming with friends, passive and active use of social media Very socially active (716) 45% 26% 29% Heavy user Somewhat socially active (1142) 29% 42% 29% Medium user Non/ Light user Less socially active (937) 17% 55% 28% Q2. How many hours per week do you use each of the following as part of your digital social life? Q5. During an average month, how many hours do you spend on each of the following activities? Unweighted bases in parentheses
Over half (53%) say that social media makes them feel positive, with two in five (39%) feeling neutral Only around one in twenty (6%) felt social media had a negative impact on them Most POSITIVE impact on 11% 42% 39% 6% 1% Aged 18 to 34 Economically active Lived with children <18 Ethnic minorities Higher educational attainment Very positive Positive Neutral Negative Very negative Don't know 53% positive 6% negative Q3. You said that you spend time on social media each week. How does spending this time on social media make you feel? Unweighted sample base: 2323 (those that spend time on social media)
For residents that feel positive about their use of social media, many use it for enjoyment and relaxation, to feel connected and to research topics of interest To have fun/enjoy myself/relax 39% Feel connected (keeping in touch with friends/family) 38% Look up topics/areas of interest (local news/events, hobbies, etc) 30% Updates on current events/news 8% Browsing/passing time 7% I can block/scroll past/ignore content I don't like/don't want to see 4% Q4. Please can you explain your answer? Unweighted sample base: 1236 (those who were positive about time spent on social media and answered the question) Showing responses provided by >2% of respondents
Illustrative positive comments about time spent on social media I enjoy seeing what other people are getting up to in their lives, staying connected with friends and being inspired by strangers It s nice to engage with others I like to be educated and informed about things that are happening and other health related issues that affect my life I keep up with family and friends that are not local to me and local news I use it to get inspiration, whether that s home decor or fashion and I also engage with content creators I enjoy I enjoy seeing what my friends and family are doing I look out for academic research and spiritual development contents I enjoy spending time on social media because I can connect with my friends and family I use it mainly to catch up and keep in contact with friends and family, I really enjoy doing that I learn a lot from time spent on social media With social media, I can connect with friends and family which makes me very happy It helps me relax and connect with family and friends. It also entertains me Q4. Please can you explain your answer? Unweighted sample base: 1236 (those who were positive about time spent on social media and answered the question)
Negativity around social media use is largely driven by feeling that it is an unproductive use of time and can be a depressing or sad experience Waste of time (killing time/endless scrolling "doomscrolling"/unproductive) 45% Bad/negative (depressing/sad/heavy) 35% Seeing other people's reactions/comments that are negative/rude/hateful 19% Other people's lives seem better than mine 10% Poor quality (fake/meaningless/nonsense) 9% Trivial (celeb gossip/pop culture) 8% Q4. Please can you explain your answer? Unweighted sample base: 145 (those who were negative about time spent on social media and answered the question) Showing responses provided by >2% of respondents
Illustrative negative comments about time spent on social media A lot of the content is news and politics and I find it depressing It s often bad news or celebrity items I see how well some people are doing which makes me feel I'm under achieving yet I also see stories about people worse off than me which is concerning It takes away a lot of my time which I could use to do some productive work There is too much fake news plus a lot of nonsense It makes me feel unproductive, but I cannot seem to stop it I feel jealous of seeing everybody else with lot of money enjoying themselves There are a lot of people that leave harmful and abusive comments, not so much for me, but for other people, which can be quite horrible to see I think the internet is a negative place to be most of the time, of course there are nice things to see and uplifting things but the majority are heavy, depressing and negative I don't feel at the time it's negative but looking back probably is Q4. Please can you explain your answer? Unweighted sample base: 145 (those who were negative about time spent on social media and who answered the question)
The most common social activity of West Midlands residents is socialising with family and friends Showing average hours per month spent doing these activities 11.6 7.7 4.8 2.3 2.3 1.7 1.6 Socialising with friends and family Faith Attending a sports event as a spectator Exercise Learning or Personal development Cultural activities Community and Volunteering Q5. During an average month, how many hours do you spend on each of the following activities? Unweighted sample base: 2800
Two thirds (65%) feel positive about their social life, with just one in ten (11%) feeling negative Among other differences, younger residents and those who feel welcome and connected to the community are more likely to feel positive about their social life More likely to feel positive about social life 8% 3% 2% 18% 47% 22% Males Aged 18-34 Married/ legal partnership Living with children >18 Economically active Higher household income Christian/ Muslim/ Hindu Ethnic minority Higher educational attainment More active in community More likely to feel: Welcome/included in community Connected to community Very positive Positive Neutral Negative Very negative Don't know 65% positive 11% negative Q6. How do you feel about your social life? Unweighted sample base: 2800
Residents who spend more time socialising with family and friends, feel more positive about their social life Non-heterosexual residents spend less time with family and friends vs their heterosexual counterparts Showing average hours per month spent doing this activity 13.0 9.8 6.8 Socialising with friends and family Feel negative about social life (309) Feel neutral about social life (637) Feel positive about social life (1810) Other notable differences Heterosexual residents spend more time socialising with family and friends vs those who are not heterosexual Those aged 55+ spend more time socialising with family and friends vs those aged 18-54 Q5. During an average month, how many hours do you spend on each of the following activities? Unweighted sample bases in chart parentheses
More time spent exercising equates to greater positive feelings about social lives With this trend in mind, it is important to look at who is not able to spend so much time exercising it appears there are greater barriers to exercising in the following groups females, under 55s, lower income/higher deprivation, ethnic minorities, those not identifying as heterosexual, those with disabilities and those with lower educational attainment Showing average hours per month spent doing this activity 10.4 9.2 9.0 8.8 7.2 7.0 6.0 5.0 Exercise e.g. attending a sports club, attending a gym, running, going for a walk, yoga Feel negative about social life (309) Feel neutral about social life (637) Feel positive about social life (1810) IMD 1st quintile (1043) IMD 2nd quintile (449) IMD 3rd quintile (343) IMD 4th quintile (277) IMD 5th quintile (236) More time exercising Less time exercising Males Aged 55+ White Higher educational attainment Heterosexual Females Aged 18-54 Ethnic minority Lives with a disability Lower educational attainment Not heterosexual Q5. During an average month, how many hours do you spend on each of the following activities? Unweighted sample bases in chart parentheses
Residents who spend more time involved in cultural activities, feel more positive about their social life Lower income/higher deprivation, economic inactivity, being female, from an ethnic minority, disabled and lower educational attainment are associated with less time spent doing cultural activities Showing average hours per month spent doing this activity 6.3 5.8 5.8 5.2 5.0 4.4 3.4 2.6 Feel negative about social life (309) Feel neutral about social life (637) Feel positive about social life (1810) IMD 1st quintile (1043) IMD 2nd quintile (449) IMD 3rd quintile (343) IMD 4th quintile (277) IMD 5th quintile (236) Cultural activities More time involved in cultural activities Less time involved in cultural activities Males White Higher educational attainment Heterosexual Higher household income Economically active Females Ethnic minority Lives with a disability Lower educational attainment Not heterosexual Lower household income Economically inactive Q5. During an average month, how many hours do you spend on each of the following activities? Unweighted sample bases in chart parentheses
While generally more social activity = more positive sentiment about social life, it is important to note that less social activity does not all always generate negativity More than half (56%) of those who are less socially active, feel positive about their social life Very socially active (716) 76% 4% Positive about social life Somewhat socially active (1145) 64% 12% Negative about social life Less socially active (939) 56% 16% Q5. During an average month, how many hours do you spend on each of the following activities? Q6. How do you feel about your social life? Unweighted sample bases in parentheses
Residents who feel positive about their social life put it down to spending a lot of time with family and friends and having supportive friends Spend a lot of time with family/friends 28% My social life is good/ok 27% I have good/supportive friends 23% It makes me feel good (relax/relieve stress) 17% I don't have issues making friends/building relationships 10% Plan/do regular meet-up/hang-outs 10% I do hobbies/activities 9% I don't mind spending time alone sometimes 4% Q7. Please can you explain your answer? Unweighted sample base: 1791 (those who were positive about their social life and answered the question) Showing responses provided by >2% of respondents
Illustrative positive comments about social life I love to spend time with friends and relatives, I am quite lucky in the fact that I have a decent family structure around me I feel positive about my social life as I have strong connections with family, friends, and my community I have a small group of close friends & I am happy with that Spending time with family and friends is essential in life I enjoy regularly meeting up with friends and family I m lucky as I have a large group of friends. Also friends online I keep in touch with It s great to be with our family, especially sons and granddaughter It gives me joy to connect with my family so I feel confident and positive I have a small but close and loyal group of friends and I stay in touch with them regularly These are positive and good for mental health, looking forward to it being more active when partner retires in the future Q7. Please can you explain your answer? Unweighted sample base: 1791 (those who were positive about their social life and who answered the question)
Negative sentiment about residents social lives are driven by not having friends, not going out enough and issues maintaining friendships Don't have a social life/any friends 27% 17% Don t go out as much/do much 15% Issues maintaining friendships (not enthusiastic/don't make an Poor mental health 12% Feel lonely/isolated 11% Superficial/surface level (lack of deep/meaningful connection) 9% 9% Lack of time (Family/caring responsibilities prevent me Issues meeting people/making new friends 8% Lack of time (Work-life balance issues) 8% Financial struggles (no money/can't afford to socialise) 8% Disability/mobility issues 6% 4% Feel I have a bad personality (boring/annoying/not good Relationship issues/struggles 3% Long distance friendships 3% Q7. Please can you explain your answer? Unweighted sample base: 309 (those who were negative about their social life and answered the question) Showing responses provided by >2% of respondents
Illustrative negative comments about social Maybe due to my age I don't feel enthusiastic anymore I don't have a girlfriend or any serious friends so I feel isolated and lonely My friends are far away and there is no community spirit where I live, no one talks to you I am not sure it feels like due to lack of motivation and nothing happening around me it seems like I am wasting my youth Events have made me miserable and depressed. Tend to stay at home and remain isolated. I am not good company for socialising so avoid it I m quite introverted and prefer to stay indoors. The only time I socialise is when I either really need to go out or when I have made plans with my friends I don t go out, I have no one to go with I don't have friends in real life and just a couple of online friends. I have a difficult relationship with my mum due to her alcohol consumption and the way she treats me, so feel alienated from family I feel left behind I feel like I am not sociable, people can easily get bored around me Q7. Please can you explain your answer? Unweighted sample base: 309 (those who were negative about social life and who answered the question)
Profile of those who feel negative about their social life Those who feel most negative about their social life would like to have more money, more confidence, and changes to their environment to make it easier to meet people Broad characteristics of those who feel more negative about their social life Those who feel negative about their social life are more likely than those who feel positive or neutral to wish for changes to their social life, particularly: Female Live alone Live with a disability or long-term health condition Economically inactive Experiencing greater deprivation Lower educational attainment No religion White Less socially active/ active in community Feel less connected to/ welcome in community Less likely to have people to rely on Seek more connection to community Less likely to trust people in neighbourhood More likely to be negative about their area Less digitally confident Feel negative about time spent on social media Feel other people s lives seem better than theirs (on social media) To have more money To have more confidence to go out To have alternative ways to meet new people To have a safer neighbourhood to meet people To have easily accessible and suitable places to meet people Q6. How do you feel about your social life? Q8. What changes, if any, would you like to make to your social life? I would like: Unweighted sample base: 309 (those who feel negative about their sociall life)
When asked about changes residents would like to make to their social life, approaching half (45%) say they would like more money One in five (20%) wished for more suitable activities or to be less busy To have more money 45% To have more activities at a time of day suitable for me 20% To be less busy 20% To have more confidence to go out 18% 81% 17% To have easily accessible and suitable places to meet of residents would like to make changes to their social life To have a safer neighbourhood to meet people 17% To have more time to myself/ alone 17% 15% To have fewer household responsibilities so I have To have alternative ways to meet new people 15% 14% To have better access to more suitable transport to 8% To have more/better childcare or support for my caring I do not want to make any changes to my social life 19% Q8. What changes, if any, would you like to make to your social life? I would like: Unweighted sample base: 2800
Who is most likely to want to make changes to their social life? The top change that residents in all these groups would like is to have more money 85% or more of the following groups of residents want to make changes to their social life Aged 18-54 Household income of 60,000+ Not heterosexual Black/Mixed ethnicity Economically active Higher educational attainment Never married Currently/ previously served in the armed forces Lives with children under 18 Lives with extended family Live with lodgers/housemates Feel negative about social life Does not have people to rely on Does not feel welcome/ included in community Already active in community Spending more time on digital social activity Q8. What changes, if any, would you like to make to your social life? I would like: Unweighted sample bases range from 47 to 15921
Focus on specific changes that certain groups would like to make to their social life Women are more likely than men to wish for changes, particularly: More money More activities at a suitable time More confidence to go out Fewer household responsibilities More/better childcare or support for caring responsibilities More time to myself/ alone Residents from ethnic minorities are more likely than white residents to wish for changes, particularly: Less busy More time to myself/alone Accessible and suitable places to meet people Alternative ways to meet new people More/better childcare or support for my caring responsibilities LGBTQ+ individuals are more likely to wish for changes, particularly: More activities at a suitable time Alternative ways to meet new people Accessible and suitable places to meet people More money Q8. What changes, if any, would you like to make to your social life? I would like: Unweighted sample bases range from 117 to 2611
Focus on specific changes that certain groups would like to make to their social life Younger people aged 18-34 are more likely than over 35s to wish for changes, particularly: Better access to more suitable transport More activities on offer at a time of day that is suitable for me Easily accessible and suitable places to meet people More/better childcare or support for my caring responsibilities Those in work are more likely than those not working to wish for changes, particularly: More activities on offer at a time of day that is suitable for me Fewer household responsibilities More time to myself/ alone Less busy Alternative ways to meet new people Safer neighbourhood to meet people More/better childcare or support for my caring responsibilities More money Those living with a disability/long-term health condition are more likely than those without to wish for: More confidence to go out Better access to more suitable transport Safer neighbourhood to meet people Easily accessible and suitable places to meet people Q8. What changes, if any, would you like to make to your social life? I would like: Unweighted sample bases range from 641 to 2125
Social inclusion and civic participation
Almost six in ten (57%) feel welcome and included in community events and spaces One in five (20%) feel very welcome and included, whilst a further one in three (36%) feel quite welcome/ included. Just 7% do not feel welcome/ included 36% 57% 29% Feel welcome and included in community 20% 7% 5% 3% Don't know Not at all welcome and included Not very welcome and included Neutral Quite welcome and included Very welcome and included More likely to feel welcome/ included Less likely to feel welcome/ included Males 18 to 34s Live with children <18 Economically active Ethnic minorities Muslim/Hindu Higher Household income Higher educational attainment More digitally confident/ connected More socially active/ active in community Over 35s Economically inactive Living alone Living with disability Lower Household income No religion White Lower educational attainment Less digitally confident/ connected Less socially active/ active in community Q9. To what extent do you feel welcomed and included in community events or spaces? Unweighted sample base: 2800
Over one third (36%) of residents are at least a little active in their local community Two in five (41%) are not at all active in their local community 41% 36% active in community 21% 15% 13% 7% 2% Don't know I am not at all active in my local community I am not very active in my local community I am a little active in my local community I am quite active in my local community I am very active in my local community More likely to be active in community Less likely to be active in community Males 18 to 34s Economically active Higher Household income Live with children <18 Ethnic minorities Higher educational attainment Digitally confident/ connected Positive about social life Feel welcome/ connected to community Over 55s Economically inactive Lower Household income Live alone No religion White Living with disabilities Lower educational attainment Less digitally confident/ connected Negative about social life Does not feel welcome/ connected to community Q10. Which of the following best describes the extent to which you are involved in your local community voluntarily (i.e. not paid for your time)? Unweighted sample base: 2800
Residents active in their community want to give back to their community, to spend time with others, volunteer for enjoyment and because it gives them purpose To give back to the community/ to have an impact on the community 38% To spend time with other people/friends 37% For enjoyment/ to have fun 34% It gives me purpose/ it is important to me 34% To make new friends 29% It gets me out of the house 28% To improve my mental health 28% To spend time with people who are like me 26% To use or develop my skills 24% I have spare time 21% To stop me feeling lonely 15% I feel that it is my duty/ I have to 14% To make other people think positively about me 13% Q11. Which of the following best describes why you are active in your local community? Unweighted sample base: 1015 (those who are active in their local community) Showing responses provided by >2% of respondents
Lack of time is the greatest barrier to community participation I don't have enough time I do other things in my spare time I prefer to do things on my own I don't feel the need to get involved I don't have enough information about activities I have an illness or disability that prevents me Meeting new people/starting something new makes me anxious 32% 21% 18% 16% 15% 13% 12% 9% 9% I wouldn t/ don't enjoy it Activities are not at the right time to fit around my other The people at this type of activity are not like me I can t easily get to this type of activity I don't enjoy socialising with other people I don't have any skills to offer 7% 7% 6% 6% Other, please specify 5% It is too much/not my responsibility 3% Q12. Which of the following best describes why you are not very active in your local community? Unweighted sample base: 1737 (those who are not active in their local community) Showing responses provided by >2% of respondents
Around 2 in 5 residents (39%) feel connected to their local community A quarter (25%) do not feel connected to their community 11% 3% 9% 30% 32% 15% 39% Connected 25% Disconnected Very connected Not very connected Quite connected Not at all connected Neutral Don't know More likely to feel connected to community Less likely to feel connected to community Males 18-34s Living with partner Living with children <18 Economically active Hindu/ Muslim Ethnic minorities Higher educational level Higher Household income Digitally confident Positive about social life Feels welcome/active in community Has people to rely on Over 55s Living alone Economically inactive No religion Bisexual White Living with disability Lower educational level Lower Household income Negative about social life Does not feel welcome/ not active in community Does not have people to rely on Q13. Which of the following best describes how connected you feel to your local community? Unweighted sample base: 2800
More than half (56%) of residents would like to experience greater connection to their community A large minority (39%) are happy with the extent to which they feel connected to their community. Just 1% are seeking less connection than they currently have 56% 12% 23% 21% 39% 1% 4% of residents would like to feel more connected to their local community I would like to feel much more connected I would like to feel somewhat more connected I would like to feel a little more connected No change to connection I would like to feel less connected Don't know More likely to be seeking greater connection Females Aged 18-34 Bisexual Muslim/ Hindu/ Christian Ethnic minorities Economically active Higher Household income Higher educational attainment Lives with children <18 Lives with lodgers/housemates Already feels connected to community Q14. Which of the following best describes how, if at all, you would like the connection you feel to your local community to change? Unweighted sample base: 2800
Not everyone who feels less connected to their community wants this to change Among those who do not feel connected to their local community, almost half (48%) do not want this to change. Two thirds (66%) of those who already feel connected to their local community, are seeking even greater connection Connected to local community (1102) 66% 33% Seeking more connection No change Neutral (908) 55% 41% 1% Seeking less connection Not connected to local community (710) 46% 48% 2% Q13. Which of the following best describes how connected you feel to your local community? Q14. Which of the following best describes how, if at all, you would like the connection you feel to your local community to change? Unweighted sample bases in parentheses
The profile of those with different relationships to their community tends to vary Connected and seeking greater connection (746) More likely vs total: Male Aged 25-44 Living with partner/ children <18 Higher Household income Economically active Christian/Muslim/Hindu Asian/Black Higher educational attainment Previously/ currently serve in armed forces Not connected and seeking greater connection (325) More likely vs total: Female Live alone Economically inactive Bisexual No religion White Live with a disability Not connected and not seeking greater connection (338) More likely vs total: Aged 55-74 Live alone Live with adult children Economically inactive No religion White Q13. Which of the following best describes how connected you feel to your local community? Q14. Which of the following best describes how, if at all, you would like the connection you feel to your local community to change? Unweighted sample bases in parentheses
Most residents (72%) trust at least some of the people living in their neighbourhood, in line with the benchmark for England The proportion of West Midlands residents that feel most people in their neighbourhood can be trusted is lower compared to the benchmark for England 72% WMCA 24% 48% 23% 5% of residents feel that at least some of the people who live in their neighbourhood can be trusted (DCMS benchmark 73%) DCMS benchmark* 41% 32% 23% 4% Many of the people can be trusted Some of the people can be trusted A few of the people can be trusted None of the people can be trusted Most likely feel many people can be trusted Least likely to feel many people can be trusted Males Aged 55+ Lower deprivation Christian White Higher education level Digitally confident Positive about social life Feels welcome/ active in community Has people to rely on Females Lives alone Higher deprivation Ethnic minority Living with a disability Lower education level Negative about social life Does not feel welcome/ less active in community Does not have people to rely on Q15. Thinking about the people who live in this neighbourhood, to what extent do you believe they can be trusted? Unweighted sample base: 2800 *Community Life Survey from the Department for Culture, Media and Sport, base 158,832, people aged 16 and over in England, Oct 2023 March 2024. N.B. The DCMS survey included people aged 16+, whereas this survey for WMCA included people aged 18+. Please bear in mind when interpreting results
Most residents (83%) agree that they have someone to rely on if they need help However, residents in the West Midlands are less likely to feel that they have people who would be there for them if they needed help, compared to the benchmark for England WMCA 25% 57% 13% 4% 83% 17% DCMS benchmark* 70% 25% 4% 2% Have people who would be there for them if they needed help (DCMS benchmark 94%) Do not have people who would be there for them if they needed help (DCMS benchmark 6%) Definitely agree Tend to agree Tend to disagree Definitely disagree More likely to have people to rely on Less likely to have people to rely on Aged 55+ Married/partnership Lower deprivation Heterosexual Muslim Asian Higher education level Digitally confident Positive about social life Feels welcome/ active in community Aged 18-54 Lives alone Higher deprivation Not heterosexual No religion Mixed ethnicity Living with disability Lower education level Lacking digital confidence Negative about social life Does not feel welcome/ not active in community Q16. To what extent do you agree or disagree that 'if I needed help, there are people who would be there for me ? Unweighted sample base: 2800 *Community Life Survey from the Department for Culture, Media and Sport, base 51,560, people aged 16 and over in England, Oct 2023 March 2024. N.B. The DCMS survey included people aged 16+, whereas this survey for WMCA included people aged 18+. Please bear in mind when interpreting results


 feel confident digitally")


 say that social media makes them feel")


 feel positive about their social life, with")


 feel welcome and included in")
 of residents are at least a little")


 feel connected to their")
 of residents would like to experience")


 trust at least some of the people")
 agree that they have someone to rely")