Explore the findings of the Indiana High School Survey on risky behaviors among students, including helmet and seat belt usage, alcohol-related driving, weapon carrying, and more. Gain an understanding of concerning trends and patterns in adolescent behavior.
Please find below an Image/Link to download the presentation.
The content on the website is provided AS IS for your information and personal use only. It may not be sold, licensed, or shared on other websites without obtaining consent from the author. If you encounter any issues during the download, it is possible that the publisher has removed the file from their server.
You are allowed to download the files provided on this website for personal or commercial use, subject to the condition that they are used lawfully. All files are the property of their respective owners.
The content on the website is provided AS IS for your information and personal use only. It may not be sold, licensed, or shared on other websites without obtaining consent from the author.
E N D
Presentation Transcript
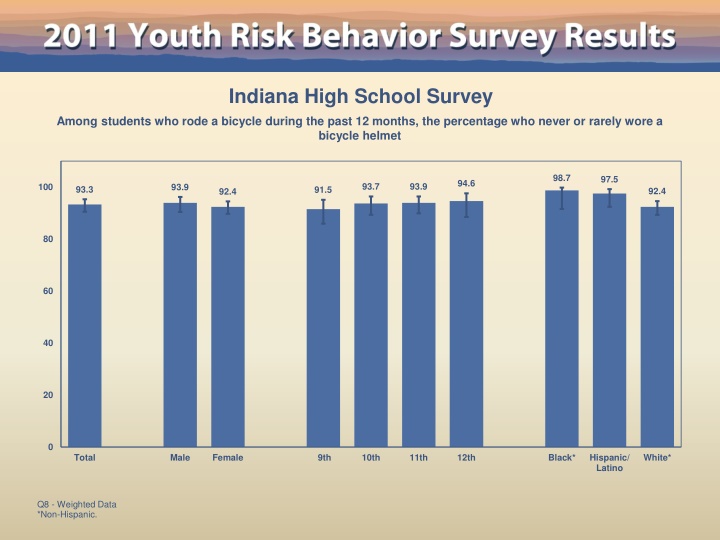
Indiana High School Survey Among students who rode a bicycle during the past 12 months, the percentage who never or rarely wore a bicycle helmet 98.7 97.5 94.6 93.7 93.9 100 93.9 93.3 91.5 92.4 92.4 80 60 40 20 0 Total Male Female 9th 10th 11th 12th Black* Hispanic/ Latino White* Q8 - Weighted Data *Non-Hispanic.
Indiana High School Survey Percentage of students who never or rarely wore a seat belt when riding in a car driven by someone else 100 80 60 40 11.8 20 10.5 11.1 9.9 7.3 7.3 8.6 7.9 6.8 6.0 0 Total Male Female 9th 10th 11th 12th Black* Hispanic/ Latino White* Q9 - Weighted Data *Non-Hispanic.
Indiana High School Survey Percentage of students who rode one or more times during the past 30 days in a car or other vehicle driven by someone who had been drinking alcohol 100 80 60 31.7 40 22.7 24.8 22.3 22.2 19.5 21.1 20.2 21.7 21.0 20 0 Total Male Female 9th 10th 11th 12th Black* Hispanic/ Latino White* Q10 - Weighted Data *Non-Hispanic.
Indiana High School Survey Percentage of students who drove a car or other vehicle one or more times during the past 30 days when they had been drinking alcohol 100 80 60 40 11.0 20 10.9 3.7 6.9 5.3 5.2 4.2 4.0 3.7 2.7 0 Total Male Female 9th 10th 11th 12th Black* Hispanic/ Latino White* Q11 - Weighted Data *Non-Hispanic.
Indiana High School Survey Percentage of students who carried a weapon such as a gun, knife, or club on one or more of the past 30 days 100 80 60 40 28.0 17.8 18.5 12.5 16.4 17.9 17.0 16.9 13.0 20 5.4 0 Total Male Female 9th 10th 11th 12th Black* Hispanic/ Latino White* Q12 - Weighted Data *Non-Hispanic.
Indiana High School Survey Percentage of students who carried a gun on one or more of the past 30 days 100 80 60 40 20 8.2 8.1 6.2 4.6 3.9 3.7 3.5 4.6 3.9 1.0 0 Total Male Female 9th 10th 11th 12th Black* Hispanic/ Latino White* Q13 - Weighted Data *Non-Hispanic.
Indiana High School Survey Percentage of students who carried a weapon such as a gun, knife, or club on school property on one or more of the past 30 days 100 80 60 40 20 6.4 3.4 5.8 4.4 4.3 3.4 2.5 3.7 3.5 1.6 0 Total Male Female 9th 10th 11th 12th Black* Hispanic/ Latino White* Q14 - Weighted Data *Non-Hispanic.
Indiana High School Survey Percentage of students who did not go to school on one or more of the past 30 days because they felt they would be unsafe at school or on their way to or from school 100 80 60 40 20 5.8 7.8 6.5 6.2 5.5 4.9 4.4 4.9 3.5 3.7 0 Total Male Female 9th 10th 11th 12th Black* Hispanic/ Latino White* Q15 - Weighted Data *Non-Hispanic.
Indiana High School Survey Percentage of students who had been threatened or injured with a weapon such as a gun, knife, or club on school property one or more times during the past 12 months 100 80 60 40 20 9.2 5.6 7.4 7.8 8.1 7.7 6.8 6.2 5.7 5.5 0 Total Male Female 9th 10th 11th 12th Black* Hispanic/ Latino White* Q16 - Weighted Data *Non-Hispanic.
Indiana High School Survey Percentage of students who were in a physical fight one or more times during the past 12 months 100 80 60 37.0 35.3 37.3 31.3 40 30.6 27.4 26.5 29.0 26.7 20.0 20 0 Total Male Female 9th 10th 11th 12th Black* Hispanic/ Latino White* Q17 - Weighted Data *Non-Hispanic.
Indiana High School Survey Percentage of students who were in a physical fight one or more times during the past 12 months in which they were injured and had to be treated by a doctor or nurse 100 80 60 40 20 3.9 4.0 3.6 4.3 2.7 3.4 4.5 3.7 3.7 3.0 0 Total Male Female 9th 10th 11th 12th Black* Hispanic/ Latino White* Q18 - Weighted Data *Non-Hispanic.
Indiana High School Survey Percentage of students who were in a physical fight on school property one or more times during the past 12 months 100 80 60 40 14.2 20 10.6 11.0 9.9 10.1 8.5 5.8 8.9 7.6 6.6 0 Total Male Female 9th 10th 11th 12th Black* Hispanic/ Latino White* Q19 - Weighted Data *Non-Hispanic.
Indiana High School Survey Percentage of students who were ever hit, slapped, or physically hurt on purpose by their boyfriend or girlfriend during the past 12 months 100 80 60 40 14.9 11.5 11.8 20 10.8 12.0 11.1 11.6 11.3 10.6 7.9 0 Total Male Female 9th 10th 11th 12th Black* Hispanic/ Latino White* Q20 - Weighted Data *Non-Hispanic.
Indiana High School Survey Percentage of students who had ever been physically forced to have sexual intercourse when they did not want to 100 80 60 40 11.4 11.6 10.0 14.5 12.8 20 8.0 9.5 9.8 6.9 5.2 0 Total Male Female 9th 10th 11th 12th Black* Hispanic/ Latino White* Q21 - Weighted Data *Non-Hispanic.
Indiana High School Survey Percentage of students who had ever been bullied on school property during the past 12 months 100 80 60 40 30.2 28.5 28.2 26.9 21.6 25.4 25.0 18.2 21.8 12.4 20 0 Total Male Female 9th 10th 11th 12th Black* Hispanic/ Latino White* Q22 - Weighted Data *Non-Hispanic.
Indiana High School Survey Percentage of students who had ever been electronically bullied during the past 12 months 100 80 60 40 25.5 17.8 16.7 20.7 18.5 19.2 15.5 18.7 18.1 20 12.1 0 Total Male Female 9th 10th 11th 12th Black* Hispanic/ Latino White* Q23 - Weighted Data *Non-Hispanic.
Indiana High School Survey Percentage of students who felt so sad or hopeless almost every day for two weeks or more in a row that they stopped doing some usual activities during the past 12 months 100 80 60 31.5 31.4 31.6 34.5 40 31.1 27.6 28.4 29.1 26.3 23.7 20 0 Total Male Female 9th 10th 11th 12th Black* Hispanic/ Latino White* Q24 - Weighted Data *Non-Hispanic.
Indiana High School Survey Percentage of students who seriously considered attempting suicide during the past 12 months 100 80 60 40 21.3 21.6 21.6 21.5 19.0 15.3 19.5 18.9 18.3 16.3 20 0 Total Male Female 9th 10th 11th 12th Black* Hispanic/ Latino White* Q25 - Weighted Data *Non-Hispanic.
Indiana High School Survey Percentage of students who made a plan about how they would attempt suicide during the past 12 months 100 80 60 40 19.7 13.5 13.0 14.9 12.6 14.2 20 12.8 13.4 13.6 12.8 0 Total Male Female 9th 10th 11th 12th Black* Hispanic/ Latino White* Q26 - Weighted Data *Non-Hispanic.
Indiana High School Survey Percentage of students who actually attempted suicide one or more times during the past 12 months 100 80 60 40 17.6 13.0 11.6 20 11.4 12.1 10.5 8.9 11.0 9.5 9.8 0 Total Male Female 9th 10th 11th 12th Black* Hispanic/ Latino White* Q27 - Weighted Data *Non-Hispanic.
Indiana High School Survey Percentage of students who made a suicide attempt during the past 12 months that resulted in an injury, poisoning, or overdose that had to be treated by a doctor or nurse 100 80 60 40 20 7.6 5.9 5.1 3.5 3.9 4.0 2.8 3.9 3.1 1.4 0 Total Male Female 9th 10th 11th 12th Black* Hispanic/ Latino White* Q28 - Weighted Data *Non-Hispanic.
Indiana High School Survey Percentage of students who ever tried cigarette smoking, even one or two puffs 100 80 58.5 57.1 52.2 48.1 60 52.2 50.9 49.5 49.2 46.6 38.1 40 20 0 Total Male Female 9th 10th 11th 12th Black* Hispanic/ Latino White* Q29 - Weighted Data *Non-Hispanic.
Indiana High School Survey Percentage of students who smoked a whole cigarette for the first time before age 13 years 100 80 60 40 15.1 14.8 20 11.4 8.7 11.8 9.9 10.7 11.1 10.4 8.4 0 Total Male Female 9th 10th 11th 12th Black* Hispanic/ Latino White* Q30 - Weighted Data *Non-Hispanic.
Indiana High School Survey Percentage of students who smoked cigarettes on one or more of the past 30 days 100 80 60 40 22.6 18.5 19.0 19.9 19.8 18.7 18.1 16.0 20 12.6 6.6 0 Total Male Female 9th 10th 11th 12th Black* Hispanic/ Latino White* Q31 - Weighted Data *Non-Hispanic.
Indiana High School Survey Percentage of students who smoked cigarettes on 20 or more of the past 30 days 100 80 60 40 20 10.5 10.0 6.6 8.7 9.1 9.0 8.1 7.0 2.9 3.8 0 Total Male Female 9th 10th 11th 12th Black* Hispanic/ Latino White* QNFRCIG - Weighted Data *Non-Hispanic.
Indiana High School Survey Among students who reported current cigarette use, the percentage who smoked more than 10 cigarettes per day on the days they smoked during the past 30 days 100 80 60 40 8.1 8.6 9.5 20 7.2 7.2 7.7 7.1 5.5 0 Total Male Female 9th 10th 11th 12th Black* Hispanic/ Latino White* Q32 - Weighted Data *Non-Hispanic. Missing bars indicate less than 100 students in the subgroup.
Indiana High School Survey Among students who were less than 18 years of age and who reported current cigarette use, the percentage who usually got their own cigarettes by buying them in a store or gas station during the past 30 days 100 80 60 40 14.8 13.0 14.8 13.4 13.9 20 5.7 0 Total Male Female 9th 10th 11th 12th Black* Hispanic/ Latino White* Q33 - Weighted Data *Non-Hispanic. Missing bars indicate less than 100 students in the subgroup.
Indiana High School Survey Percentage of students who smoked cigarettes on school property on one or more of the past 30 days 100 80 60 40 20 6.9 3.5 4.0 5.5 2.6 3.9 4.6 4.5 3.6 3.5 0 Total Male Female 9th 10th 11th 12th Black* Hispanic/ Latino White* Q34 - Weighted Data *Non-Hispanic.
Indiana High School Survey Percentage of students who ever smoked cigarettes daily, that is, at least one cigarette every day for 30 days 100 80 60 40 17.8 15.4 14.3 14.9 14.6 8.9 13.8 20 9.7 12.6 8.6 0 Total Male Female 9th 10th 11th 12th Black* Hispanic/ Latino White* Q35 - Weighted Data *Non-Hispanic.
Indiana High School Survey Among students who reported current cigarette use, the percentage who ever tried to quit smoking cigarettes during the past 12 months 100 66.3 80 62.2 60.1 54.6 56.8 57.4 49.6 49.8 60 40 20 0 Total Male Female 9th 10th 11th 12th Black* Hispanic/ Latino White* Q36 - Weighted Data *Non-Hispanic. Missing bars indicate less than 100 students in the subgroup.
Indiana High School Survey Percentage of students who used chewing tobacco, snuff, or dip on one or more of the past 30 days 100 80 60 40 20 13.9 8.6 3.9 9.3 8.1 10.0 7.0 8.2 1.9 2.3 0 Total Male Female 9th 10th 11th 12th Black* Hispanic/ Latino White* Q37 - Weighted Data *Non-Hispanic.
Indiana High School Survey Percentage of students who used chewing tobacco, snuff, or dip on school property on one or more of the past 30 days 100 80 60 40 20 7.9 5.5 2.1 3.8 4.0 4.4 5.3 4.4 1.4 0.8 0 Total Male Female 9th 10th 11th 12th Black* Hispanic/ Latino White* Q38 - Weighted Data *Non-Hispanic.
Indiana High School Survey Percentage of students who smoked cigars, cigarillos, or little cigars on one or more of the past 30 days 100 80 60 40 23.7 20.4 13.3 13.5 14.6 14.9 14.6 20 11.8 9.4 8.4 0 Total Male Female 9th 10th 11th 12th Black* Hispanic/ Latino White* Q39 - Weighted Data *Non-Hispanic.
Indiana High School Survey Percentage of students who smoked cigarettes or cigars or used chewing tobacco, snuff, or dip on one or more of the past 30 days 100 80 60 32.2 40 29.6 25.1 27.0 24.3 24.5 18.2 19.1 17.6 13.2 20 0 Total Male Female 9th 10th 11th 12th Black* Hispanic/ Latino White* QNANYTOB - Weighted Data *Non-Hispanic.
Indiana High School Survey Percentage of students who had at least one drink of alcohol on one or more days during their life 100 78.4 78.9 74.2 72.0 80 71.3 70.0 70.5 70.4 69.4 56.6 60 40 20 0 Total Male Female 9th 10th 11th 12th Black* Hispanic/ Latino White* Q40 - Weighted Data *Non-Hispanic.
Indiana High School Survey Percentage of students who had their first drink of alcohol other than a few sips before age 13 years 100 80 60 40 24.0 18.7 20.5 20.7 20.1 17.8 17.6 16.4 15.0 20 10.5 0 Total Male Female 9th 10th 11th 12th Black* Hispanic/ Latino White* Q41 - Weighted Data *Non-Hispanic.
Indiana High School Survey Percentage of students who had at least one drink of alcohol on one or more of the past 30 days 100 80 60 43.7 39.3 37.1 34.9 27.4 34.8 33.6 33.2 33.4 40 20.9 20 0 Total Male Female 9th 10th 11th 12th Black* Hispanic/ Latino White* Q42 - Weighted Data *Non-Hispanic.
Indiana High School Survey Percentage of students who had five or more drinks of alcohol in a row, that is, within a couple of hours, on one or more of the past 30 days 100 80 60 27.3 28.5 40 19.6 21.8 21.0 20.2 19.8 18.4 20 12.3 7.6 0 Total Male Female 9th 10th 11th 12th Black* Hispanic/ Latino White* Q43 - Weighted Data *Non-Hispanic.
Indiana High School Survey Among students who reported current alcohol use, the percentage who usually got the alcohol they drank from someone who gave it to them during the past 30 days 100 80 60 49.8 43.8 41.8 37.9 34.2 39.0 38.7 40 28.0 20 0 Total Male Female 9th 10th 11th 12th Black* Hispanic/ Latino White* Q44 - Weighted Data *Non-Hispanic. Missing bars indicate less than 100 students in the subgroup.
Indiana High School Survey Percentage of students who had at least one drink of alcohol on school property on one or more of the past 30 days 100 80 60 40 20 2.8 2.9 1.9 2.5 2.2 1.1 1.7 1.9 2.0 1.5 0 Total Male Female 9th 10th 11th 12th Black* Hispanic/ Latino White* Q45 - Weighted Data *Non-Hispanic.
Indiana High School Survey Percentage of students who used marijuana one or more times during their life 100 80 54.5 60 47.7 42.1 44.3 41.0 37.2 35.1 33.9 33.3 40 23.8 20 0 Total Male Female 9th 10th 11th 12th Black* Hispanic/ Latino White* Q46 - Weighted Data *Non-Hispanic.
Indiana High School Survey Percentage of students who tried marijuana for the first time before age 13 years 100 80 60 40 10.7 11.1 20 7.5 5.9 7.9 8.1 6.3 6.9 5.8 5.8 0 Total Male Female 9th 10th 11th 12th Black* Hispanic/ Latino White* Q47 - Weighted Data *Non-Hispanic.
Indiana High School Survey Percentage of students who used marijuana one or more times during the past 30 days 100 80 60 32.1 40 24.6 21.5 23.8 23.4 20.6 20.0 17.7 16.4 20 12.2 0 Total Male Female 9th 10th 11th 12th Black* Hispanic/ Latino White* Q48 - Weighted Data *Non-Hispanic.
Indiana High School Survey Percentage of students who used marijuana on school property one or more times during the past 30 days 100 80 60 40 20 6.2 3.5 4.4 4.7 3.2 3.3 2.6 2.9 2.7 1.9 0 Total Male Female 9th 10th 11th 12th Black* Hispanic/ Latino White* Q49 - Weighted Data *Non-Hispanic.
Indiana High School Survey Percentage of students who used any form of cocaine, including powder, crack, or freebase one or more times during their life 100 80 60 40 20 6.2 8.7 5.7 6.4 4.7 5.3 5.6 5.5 4.9 4.1 0 Total Male Female 9th 10th 11th 12th Black* Hispanic/ Latino White* Q50 - Weighted Data *Non-Hispanic.
Indiana High School Survey Percentage of students who used any form of cocaine, including powder, crack, or freebase one or more times during the past 30 days 100 80 60 40 20 1.9 2.9 2.6 2.4 2.9 2.2 2.4 2.3 1.7 1.6 0 Total Male Female 9th 10th 11th 12th Black* Hispanic/ Latino White* Q51 - Weighted Data *Non-Hispanic.
Indiana High School Survey Percentage of students who sniffed glue, breathed the contents of aerosol spray cans, or inhaled any paints or sprays to get high one or more times during their life 100 80 60 40 11.2 11.4 8.6 20 12.4 10.8 11.0 10.6 8.2 10.2 10.2 0 Total Male Female 9th 10th 11th 12th Black* Hispanic/ Latino White* Q52 - Weighted Data *Non-Hispanic.
Indiana High School Survey Percentage of students who used heroin one or more times during their life 100 80 60 40 20 3.1 2.6 3.9 2.3 2.5 3.7 2.6 2.8 2.7 1.7 0 Total Male Female 9th 10th 11th 12th Black* Hispanic/ Latino White* Q53 - Weighted Data *Non-Hispanic.
Indiana High School Survey Percentage of students who used methamphetamines one or more times during their life 100 80 60 40 20 5.1 3.9 4.8 4.5 3.0 3.9 3.8 4.0 3.4 3.7 0 Total Male Female 9th 10th 11th 12th Black* Hispanic/ Latino White* Q54 - Weighted Data *Non-Hispanic.
Indiana High School Survey Percentage of students who used ecstasy one or more times during their life 100 80 60 40 8.8 20 8.7 7.5 6.7 6.1 6.4 6.3 5.5 4.7 5.1 0 Total Male Female 9th 10th 11th 12th Black* Hispanic/ Latino White* Q55 - Weighted Data *Non-Hispanic.