Insights from The HEPI-HEA Student Academic Experience Survey 2014
Explore key findings from the 2014 HEPI-HEA Student Academic Experience Survey, including insights on personal wellbeing, course quality satisfaction, student expectations, and experiences compared to expectations. Discover student perspectives on various aspects of their academic journey.
Download Presentation

Please find below an Image/Link to download the presentation.
The content on the website is provided AS IS for your information and personal use only. It may not be sold, licensed, or shared on other websites without obtaining consent from the author. If you encounter any issues during the download, it is possible that the publisher has removed the file from their server.
You are allowed to download the files provided on this website for personal or commercial use, subject to the condition that they are used lawfully. All files are the property of their respective owners.
The content on the website is provided AS IS for your information and personal use only. It may not be sold, licensed, or shared on other websites without obtaining consent from the author.
E N D
Presentation Transcript
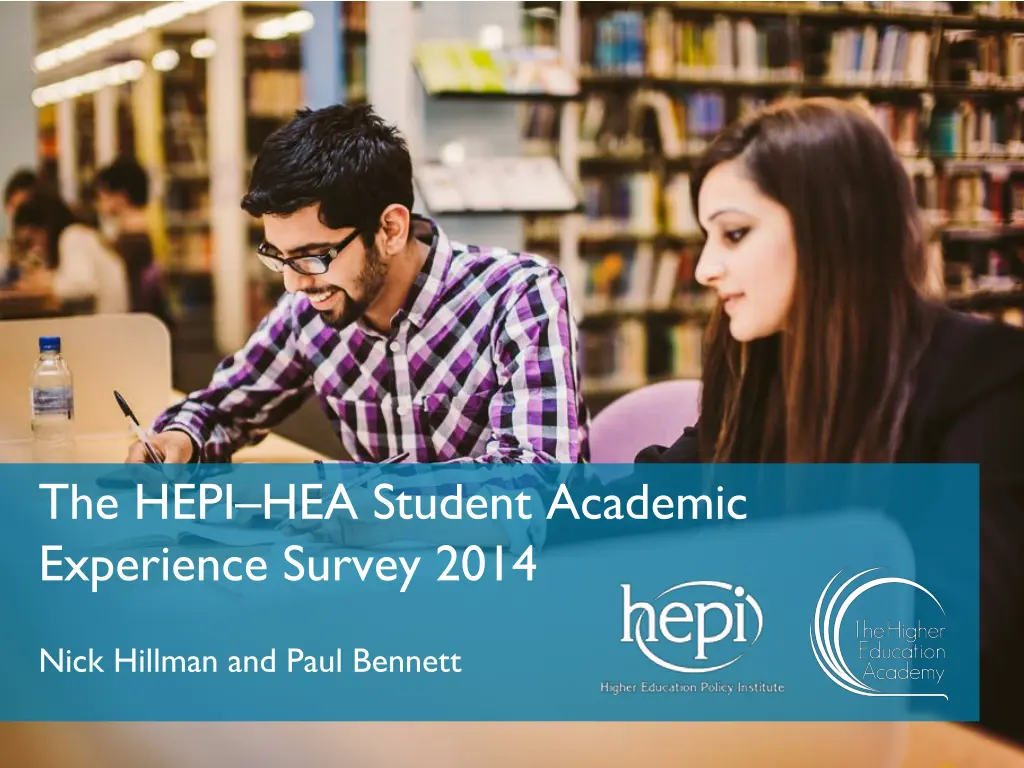
The HEPIHEA Student Academic Experience Survey 2014 Nick Hillman and Paul Bennett
The survey 15,046 respondents from YouthSight s Student Panel The panel itself recruits members via UCAS Sample comprises: - Full-time undergraduates in all year groups - From higher education institutions across the UK that receive public funding Weightings are applied to results Online survey, open 24 February 26 March 2014 Main changes for 2014: - New ONS questions on wellbeing - Improved answer options for some questions 2
Personal wellbeing of students To what extent do you feel the things you do in your life are worthwhile? How satisfied are you with your life nowadays? How happy did you feel yesterday? General population Population aged 20-24 Student population 77% 81% 72% 79% 78% 70% 74% 72% 62% Percentages are those answering 7 or higher on a scale where 1 = not at all and 10 = completely 4
Satisfaction with course quality TOTAL SATISFIED Don't know Not at all satisfied Not very satisfied Fairly satisfied Very satisfied 86% All students 3% 11% 57% 29% 89% Russell Group 9% 56% 33% 88% Pre-1992 2% 9% 57% 31% 84% Post-1992 3% 13% 58% 26% Other specialist 86% 10% 52% 34% 5
Experience compared with expectations 2014 2013 2012 27% It's been better 32% 26% 12% It's been worse 13% 11% 50% It's been better in some ways and worse in others 45% 49% 9% It's been exactly what I expected 8% 11% 2% Other/don't know 2% 2% 6
Experience worse than expectations if I haven't put in enough effort myself 36% The course was poorly organised 32% I received fewer contact hours than I was expecting 32% I didn't feel supported in my private study 28% The teaching quality was worse than I expected 27% The feedback was poor 26% There was too little interaction with staff 26% The teaching groups were too large 19% There was too little interaction with other students 19% The course was too challenging 12% The course wasn't challenging enough 11% Teaching staff were inaccessible 11% Other (please specify) 13% Don't know 3% 7
Course choices and information Whether students would have chosen differently knowing what they do now Views on information provided by the institution before commencement Year 2013 Year 2014 Yes definitely 10% 37.4% Accurate 37.9% Yes maybe 22% 7.7% Misleading 6.7% 48.7% No probably not 31% Useful 51.4% 47.2% Informative No definitely not 34% 50.7% 19.1% Vague Don't know 3% 18.2% 1.1% None of the above 1.0% N/A - Can t remember the information that was 9.8% 8 8.8%
Perceived benefit of different sized classes TOTAL POSITIVE Don't know Not at all A little Quite a bit A lot No other students 9% 31% 59% 89% 1-5 other students 87% 10% 37% 50% 6-15 other students 88% 10% 45% 42% 16-50 other students 71% 3% 24% 51% 20% 54% 51-100 other students 7% 36% 43% 11% More than 100 other students 51% 10% 37% 41% 10% 9
Hours spent in different sized classes 0.33 0.87 2.08 0 students 1-5 students 2.73 6-15 students 1.93 16-50 students 51-100 students More than 100 students 3.96 10
Hours spent in different sized classes 2014 2013 2012 2007 2006 25 20 15 10 5 0 11
Reasons for missing classes I didn t find these lectures very useful 50% I didn t feel that I needed to go because I could get the notes online 40% I was ill 31% I couldn t be bothered to attend 31% Sessions were optional 21% It was cancelled 14% I had paid work commitments 9% Other 15% Don t know 1% 12
Total workload 60 50 40 30 20 10 0 13
Perceived value for money 8% I have received very poor value for money 8% 5% 3% 8% 18% 20% I have received poor value for money All UK 17% 6% 20% England 30% I have received neither poor nor good value for money 31% Northern Ireland 37% 22% 30% Scotland 33% 32% I have received good value for money Wales 34% 36% 34% 12% I have received very good value for money 9% 7% 34% 8% 14 0% 5% 10% 15% 20% 25% 30% 35% 40%
Impact of new fees on perceived VFM Year 2014 Year 2012 10.5% I have received very poor value for money 4.0% 22.6% I have received poor value for money 14.3% I have received neither poor nor good value for money 30.6% 29.6% 28.4% I have received good value for money 41.3% 7.9% I have received very good value for money 10.8% 0% 5% 10% 15% 20% 25% 30% 35% 40% 45% First and second years studying in England who are from England, Northern Ireland or Scotland 15
Impact on experience vs expectations Year 2014 Year 2012 0% 10% 20% 30% 40% 50% 60% 28.1% 26.7% It s been better 11.7% 11.3% It s been worse It s been better in some ways and worse than others 50.2% 49.1% 9.6% 10.8% It s been exactly what I expected .4% Other/don t know 2.2% First and second years studying in England who are from England, Northern Ireland or Scotland 16
Students views on spending priorities Ranked as top three answer Ranked as top answer 48% Reducing fee levels 23% 35% Having more hours of teaching 15% 35% Reducing the size of teaching groups 14% 34% Better training for lecturers 13% 34% Providing better learning facilities 11% 24% Better financial support for hard-up students 7% 18% Providing better access to staff outside teaching 4% 14% Supporting students to settle into the university 3% 14% Other support services (careers, 2% 12% Better pay for staff 1% 11% Better buildings 2% 11% Better sport or social facilities 2% 7% Giving academics more time for research 1% 2% Better security on campus 0 17
The HEPIHEA Student Academic Experience Survey 2014 Nick Hillman and Paul Bennett
The HEPIHEA Student Academic Experience Survey 2014 Nick Hillman and Paul Bennett


