Insights into College Student Demographics and Needs
Explore a comprehensive overview of college student demographics and needs based on data from a planning retreat. Learn about enrollment trends, student age distribution, ethnicity, gender ratios, origin locations, academic goals, and support requirements such as developmental education and financial aid. Gain valuable insights into the diverse student population and their educational journey.
Download Presentation

Please find below an Image/Link to download the presentation.
The content on the website is provided AS IS for your information and personal use only. It may not be sold, licensed, or shared on other websites without obtaining consent from the author. If you encounter any issues during the download, it is possible that the publisher has removed the file from their server.
You are allowed to download the files provided on this website for personal or commercial use, subject to the condition that they are used lawfully. All files are the property of their respective owners.
The content on the website is provided AS IS for your information and personal use only. It may not be sold, licensed, or shared on other websites without obtaining consent from the author.
E N D
Presentation Transcript
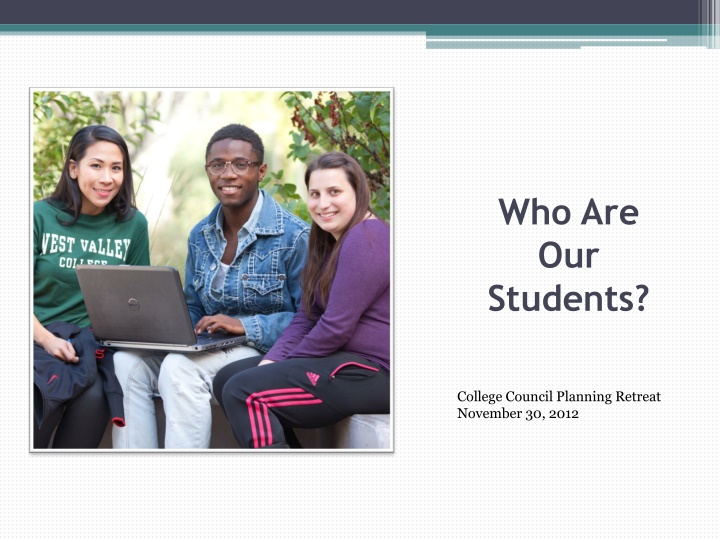
Who Are Our Students? College Council Planning Retreat November 30, 2012
Fast Facts - Fall 2012: 10,288 students enrolled (6.6% decrease from Fall 2011) Average number of units of enrollment: 8.3 30% attending WVC full time
Enrollment Trend 2002 - 2012 25,000 20,000 15,000 10,000 5,000 0 Annual 2002-2003 Annual 2003-2004 Annual 2004-2005 Annual 2005-2006 Annual 2006-2007 Annual 2007-2008 Annual 2008-2009 Annual 2009-2010 Annual 2010-2011 Annual 2011-2012
Student Age 26.3% 30.0% 20.3% 25.0% 16.5% 20.0% 10.5% 10.2% 15.0% 6.4% 5.3% 10.0% 4.3% 5.0% 0.0% Under 18 18 & 19 20 - 24 25 - 29 30 - 34 35 - 39 40 - 49 50+
Student Ethnicity 45.2% 50.0% 45.0% 40.0% 35.0% 30.0% 18.0% 25.0% 14.1% 13.8% 20.0% 15.0% 3.3% 2.8% 2.0% 0.4% 0.4% 10.0% 5.0% 0.0%
Student Gender Male, 45.7% Female, 53.3%
Where Are They From? Leigh Westmont Los Gatos Santa Teresa Leland Pioneer Branham Prospect Saratoga Oak Grove
What Are Their Goals? 54.3% 60.0% 50.0% 17.9% 16.5% 40.0% 11.4% 30.0% 20.0% 10.0% 0.0% Transfer Vocational Other (Personal Interest, GED) Undecided or Unreported
What Do They Need? Developmental Education: 6% of all enrollments are in Basic Skills courses 24.6% of English enrollments 47.2% of Math enrollments 51.1% of Reading enrollments Support services: at least 4% of students have a disability 1,400+ students receive tutoring annually
What Do They Need? (contd) Financial Aid (estimate as of 10/16/12): 4600 students received BOG waivers (2011-2012) Annual financial aid awarded: $10,913,081 Source WVC Financial Aid Office
What Do They Study? Most popular degrees, 2011-2012: Humanities (English, Communication) Liberal Arts & Sciences Biological and Physical Sciences Most popular certificates, 2011-2012: Child Development/Early Care and Education Paralegal Interior Design and Merchandising
Achieving Their Goals In 2011-2012: 552 earned Associate degrees 170 earned Certificates In 2010-2011: 105 transferred to a UC 586 transferred to a CSU 47.7% of those with behavioral intent to transfer (a.k.a. transfer velocity) did so within 6 years
Questions or Comments Thank you!


