Insights into Disability Statistics: Key Findings and Trends
Explore the effective translation of disability statistics, key indicators, annual reports, and infographics shedding light on educational and social inequalities. Discover updated numbers, prevalence, poverty rates, and health insurance insights, with more detailed reports available.

Uploaded on | 0 Views
Download Presentation

Please find below an Image/Link to download the presentation.
The content on the website is provided AS IS for your information and personal use only. It may not be sold, licensed, or shared on other websites without obtaining consent from the author. If you encounter any issues during the download, it is possible that the publisher has removed the file from their server.
You are allowed to download the files provided on this website for personal or commercial use, subject to the condition that they are used lawfully. All files are the property of their respective owners.
The content on the website is provided AS IS for your information and personal use only. It may not be sold, licensed, or shared on other websites without obtaining consent from the author.
E N D
Presentation Transcript
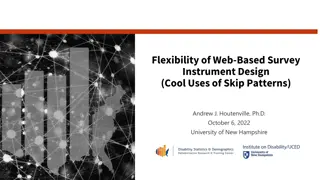
Effective Translation of Disability Statistics Andrew J. Houtenville, Ph.D. October 7, 2022 University of New Hampshire
Translating Disability Statistics The key to knowledge translation are providing multiple opportunities to access the statistics, interpretations, and stories Readily-Available Technical Assistance
Annual Report Key Indicators: Informed by the National Council on Disability (NCD) report from 2008, calling for monitoring the status of people with disabilities. Time Trends:Each year, looking to make a call each year on whether we observe statistically significance improvement. Data Source: American Community Survey Public Use Microdata Sample (ACS PUMS).
Background on Infographics 1-page overview with visual summary Explores the intersection of disability and other identities Created in partnership with subject experts New subject areas added each year
African- Americans with Disabilities
Updated Numbers 2014-2019 ACS 5-year data In More Rural Places, Disparities Widen
Poverty Rate
Health Insurance
More detail available See our full reports for: Data on other racial and ethnic groups Other education statistics Other employment statistics Other housing statistics Find it all at disabilitycompendium.org
Thank you! Get in touch: Andrew.Houtenville@unh.edu Shreya.Paul@unh.edu Megan.Henly@unh.edu Stacia.Bach@unh.edu