Insights into Epigenetic and Genomic Studies in Cancer Research
July 22, 2019 reviews on constitutional mosaic epimutations, inferring interaction networks from multi-omics data, solving the missing heritability problem, and a draft periodic table of cell types. Also covers comprehensive DNA methylation analysis and detection of cell-type-specific risk-CpG sites in epigenome-wide association studies.

Download Presentation

Please find below an Image/Link to download the presentation.
The content on the website is provided AS IS for your information and personal use only. It may not be sold, licensed, or shared on other websites without obtaining consent from the author.If you encounter any issues during the download, it is possible that the publisher has removed the file from their server.
You are allowed to download the files provided on this website for personal or commercial use, subject to the condition that they are used lawfully. All files are the property of their respective owners.
The content on the website is provided AS IS for your information and personal use only. It may not be sold, licensed, or shared on other websites without obtaining consent from the author.
E N D
Presentation Transcript
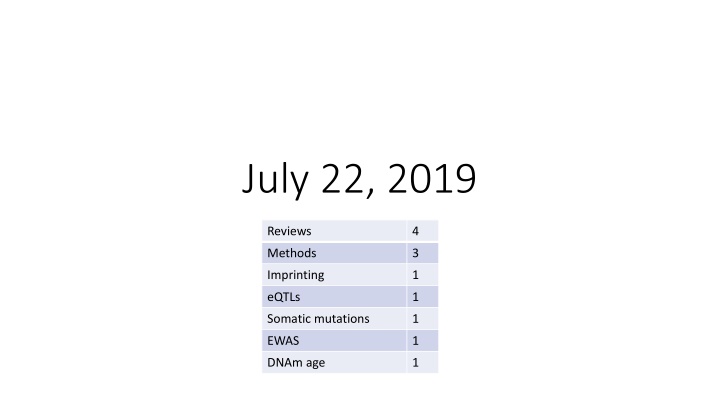
July 22, 2019 Reviews 4 Methods 3 Imprinting 1 eQTLs 1 Somatic mutations 1 EWAS 1 DNAm age 1
Reviews L nning, Per E et al. Constitutional Mosaic Epimutations - a hidden cause of cancer?. Cell stress vol. 3,4 118-135. 22 Mar. 2019. Mosaic methylation of genes linked genetically to cancer risk may cause cancer and be useful as biomarkers. Hawe, Johann S et al. Inferring Interaction Networks From Multi-Omics Data. Frontiers in genetics vol. 10 535. 12 Jun. 2019 "we review state-of-the-art techniques for inferring the topology of interaction networks from functional multi-omics data Young, Alexander I. Solving the missing heritability problem. PLoS Genetics vol. 15,6 e1008222. 24 Jun. 2019 A letter describing challenges of expanding analyses to the whole genome and suggesting solutions.
Reviews Xia B, Yanai I. A periodic table of cell types. Development. 2019 Jun 27;146(12). pii: dev169854. A framework for distinguishing between cell type and cell state in single-cell RNA-seq. Old approach New approach cell type = expression profile of transcription factors
Draft periodic table of cell types Limitations 1. Different table for each species. 2. Over-simplifies complexity of differentiation. Advantages 1. Systematically organizes what we know. 2. Identifies cell types that are missing. 3. Can be built from less complex to more complex organisms.
Methods Liu, Xiaomeng et al. Comprehensive DNA methylation analysis of tissue of origin of plasma cell-free DNA by methylated CpG tandem amplification and sequencing (MCTA-Seq). Clinical Epigenetics vol. 11,1 93. 24 Jun. 2019. Use DNA methylation patterns of circulating DNA to identify tissue-of-origin. Anke H ls & Darina Czamara (2019) Methodological challenges in constructing DNA methylation risk scores, Epigenetics. Discusses differences between polygenic risk scores and DNAm scores.
Methods Luo X, Yang C, Wei Y. Detection of cell-type-specific risk-CpG sites in epigenome-wide association studies. Nat Commun. 2019;10(1):3113. Published 2019 Jul 15. A method for improving power of EWAS in complex tissues. Reference EWAS model essentially adjusts for cell type in order to identify an aggregate effect across all cell types. It fits the following model for each CpG site: Oi = observed methylation for individual i at the CpG site T = effects of each phenotype on methylation xi = phenotype values for individual i M = cell-type specific methylation levels pi = cell-type proportions for individual i
EWAS for cell-type specific effects Parameters estimated by a generalized expectation- maximization algorithm. Two-layer hierarchical model Cell-type proportions are initially estimated using Houseman s algorithm. 3 cell types Cell-type specific baseline methylation profiles are initially estimated by simple linear regression. i = individual (n) j = CpG site l = phenotype k = cell type (pBIC used to select optimal K)
Performance of HIRE under simulations A few associations | No associations
Simulated data with true associations Rheumatoid arthritis whole blood dataset (cases vs controls) 1=CD4+ 2,4 = Neutrophils 3 = ? (has the strongest associations) 1
Imprinting Jadhav, Bharati et al. RNA-Seq in 296 phased trios provides a high- resolution map of genomic imprinting. BMC biology vol. 17,1 50. 24 Jun. 2019, doi:10.1186/s12915-019-0674-0 "7 [new] transcripts showing parental bias in gene expression"
eQTLs and differentation Strober BJ, Elorbany R, Rhodes K, Krishnan N, Tayeb K, Battle A, Gilad Y. Dynamic genetic regulation of gene expression during cellular differentiation. Science. 2019 Jun 28;364(6447):1287-1290. 19 Yoruban individuals induced pluripotent stem cells 16 time points during differentiation into cardiomyocytes
Somatic mutations Park, Jun Sung et al. Brain somatic mutations observed in Alzheimer's disease associated with aging and dysregulation of tau phosphorylation. Nature communications vol. 10,1 3090. 12 Jul. 2019, doi:10.1038/s41467-019-11000-7 "deep whole-exome sequencing (average read depth 584 ) in 111 postmortem hippocampal formation and matched blood samples from 52 patients with AD and 11 individuals not affected by AD." The amount of genetic variation increases with age in the brain but at 4.8-fold slower rate than in blood. There is enrichment for variation accumulating near genes "known to contribute to hyperphosphorylation of tau".
EWAS Ringh, Mikael V. et al. Tobacco smoking induces changes in true DNA methylation, hydroxymethylation and gene expression in bronchoalveolar lavage cells, EBioMedicine, 2019 Jul 11. pii: S2352- 3964(19)30441-4. "We identified 1667 total 5mC + 5hmC, 1756 5mC and 67 5hmC differentially methylated positions (DMPs) between smokers and non-smokers (FDR- adjusted P <.05, absolute >0.15)." Most were novel for smoking differences. Directions of 5mC and 5hmC differences indicated that smoking demethylated DNA via conversion to 5hmC.
DNAm age Liu, Zuyun et al. Associations of genetics, behaviors, and life course circumstances with a novel aging and healthspan measure: Evidence from the Health and Retirement Study. PLoS medicine vol. 16,6 e1002827. 18 Jun. 2019, doi:10.1371/journal.pmed.1002827 "Based on data from 2,339 adults (aged 51+ years, mean age 69.4 years, 56% female, and 93.9% non-Hispanic white) from the US Health and Retirement Study genetic, behavioral, and socioenvironmental circumstances during childhood and adulthood account for about 30% of differences in" PhenoAge variation. "behaviors had the largest contribution to PhenoAge".