Insights into European Access Hurdles Portal Findings
Discover key insights from the European Access Hurdles Portal report, highlighting industry transparency efforts, root causes of unavailability, and the impact on innovative medicines availability. Explore data on therapy areas, industry participation, and delays in the filing and reimbursement process.

Download Presentation

Please find below an Image/Link to download the presentation.
The content on the website is provided AS IS for your information and personal use only. It may not be sold, licensed, or shared on other websites without obtaining consent from the author. If you encounter any issues during the download, it is possible that the publisher has removed the file from their server.
You are allowed to download the files provided on this website for personal or commercial use, subject to the condition that they are used lawfully. All files are the property of their respective owners.
The content on the website is provided AS IS for your information and personal use only. It may not be sold, licensed, or shared on other websites without obtaining consent from the author.
E N D
Presentation Transcript
European Access Hurdles Portal: Report summary 20th April 2023
The industry created the European Access Hurdles Portal to add new information to the debate on availability of innovative medicines Created in April 2022, the role of the Portal is to improve transparency regarding the root causes of unavailability and delay, including the role of the environment and its corresponding impact on commercial decision-making 2010 First report on the Patients W.A.I.T. (Waiting to Access Innovative Therapies) Indicator Root cause of unavailability and delay The reason why a company has not filed for P&R in a particular market The reason why there is a delay in the decision of Pricing and Reimbursement 2020-2022 Annual reporting on Patients W.A.I.T. Indicators and root causes of unavailability Ex-post information to be collected through EFPIA s Portal Targeting European Access Application for P&R or Filing information EFPIA s WAIT has information on availability and delay IRIS portal collects information on marketing status for all CAPs Ex-ante information collected availabilitythrough DGSante s pilot April 2022 Industry commitment to the creation of the European Access Hurdles Portal on planned Marketing status information Novelty of the data April 2023 Release of the first public report from the Portal 2
Results indicate a clear willingness from industry to provide more transparency on the root causes of unavailability Industry participation Data completeness and representativeness Therapy areas of products approved by the EMA between Jan 2021-Jun 2022 Therapy areas of products included in the Portal dataset for Jan 2021-Jun 2022 Data on 32 products were submitted to the Portal. All received European marketing authorisation between January 2021 and June 2022. 32 A total of 21 out of the 23 EFPIA member companies with eligible products submitted data to the Portal (91% participation). 91% The analysis described in this report is therefore representative of approximately 82% of all products approved by the EMA between January 2021 and June 2022 that are marketed by EFPIA members 82% The therapy areas of these products and the composition of products approved by the EMA over the same time period are similar suggesting the products within the Portal are representative 3 Abbreviations: EFPIA = European Federation of Pharmaceutical Industries and Associations; EMA = European Medicines Agency
This report presents a first preliminary analysis focusing on a short list of key research questions Speed of marketing authorisation Status of filing and reimbursement Speed of filing and reimbursement Root causes of delays To what extent is delayed reimbursement of new medicines due to the time taken at different steps of the P&R process? How does Europe compare to other regions in terms of the timing of marketing authorisation? What proportion of new medicines have been filed for P&R, and in how many countries? Where new medicines have not been filed for P&R in all countries, what are the most prevalent root causes of this? The reasons for both delays in P&R filing and P&R decision making are multi-factorial. The most common reasons for not filing for P&R were related to the requirements of the P&R process and health system constraints and resources Of all new products approved by international regulators between January 2021 and June 2022, EMA approval came later, on average, than the US and by Japan by 285 days and 110 days respectively While there are delays in P&R filing in for some products in some countries, this is not a key driver of low availability of medicines in all countries (accounting for 25% of the total time between MA and reimbursement on average) Looking at the Portal s products (that are on average 14 months-post MA), taking an average across European countries, more than half of products have already been filed for P&R* 4 Abbreviations: EMA = European Medicines Agency; MA = marketing authorisation; P&R = pricing and reimbursement * The industry commitment of April 2022 is to file within 2 years of marketing authorisation
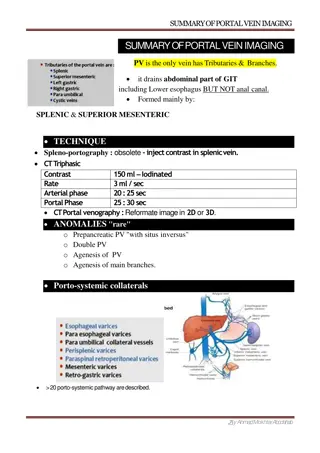
Speed of marketing authorisation Status of filing and reimbursement Speed of filing and reimbursement Root causes of delays The products in-scope of the Portal received marketing authorisation later in Europe than in the US and Japan Key findings: Speed of marketing authorisation Date of EMA approvals relative to the US, UK, Japan and China Of all new products approved by international regulators between January 2021 and June 2022, EMA approval came later, on average, than the US and by Japan by 285 days and 110 days respectively; this is broadly consistent with academic literature over the last ten years This gap closes to 229 days and 97 days with the US and Japan respectively for orphan products For oncology drugs, European marketing authorisation typically happens 47 days earlier than Japan, although still lagging behind the US Legend: No. of dates used to calculate averages: This shows that even before considering the P&R process, Europe is slower in approving new products than the regulatory agencies in other regions1 FDA to EMA FDA to PMDA FDA to NMPA FDA to MHRA All products 66 24 5 34 Oncology 22 6 3 13 Orphans 19 17 2 11 1. This lag may also be due at least in part to companies taking more time to file for marketing authorisation through the EMA compared to the FDA. Data on submission dates to the FDA and EMA are not publicly available. 5 Abbreviations: EMA = European Medicines Agency; FDA = Food and Drug Administration; MHRA = Medicines and Healthcare products Regulatory Agency; NMPA = National Medical Products Administration; PMDA = Pharmaceuticals and Medical Devices Agency
Speed of marketing authorisation Status of filing and reimbursement Speed of filing and reimbursement Root causes of delays In many instances of product unavailability, the products have in fact been filed for reimbursement but have not yet been reimbursed Key findings: Status of filing and reimbursement Status of product reimbursement and filing across countries Looking at all products included in the Portal to date (which covers products that are on average 14 months post-marketing authorisation): 0% 0% 0% 0% 0% 0% 0% 0% 0% 0% 0% 0% 3% 3% 3% 3% 3% 3% 3% 3% 100% 0% 6% 9% 9% 13% 13% 13% 16% 16% 90% 13% 19% 19% 22% 22% 22% 25% 28% 28% 28% 25% 25% 6% 38% 80% 34% 44% Taking an average across European countries, 56% of products have been filed for P&R. Of which: 41% 41% o 31% 39% 22% 31% 50% 56% 70% 53% 63% 44% 69% 47% 28% 19% 19% 69% 59% 60% 13% 50% 34% 63% 16% 47% 53% 50% 44% 63% 31% 66% 28% 41%of filed products have been reimbursed 40% 31% 63% 78% 47% 33% 38% 28% 50% 30% 28% 47% 53% 50% 50% 41% 41% 44% 20% 41% 22% 38% 25% 38% 31% 31% 25% 28% 28% 28% 9% 22% 59%of filed products are pending a reimbursement decision 25% 23% 22% 10% 19% 19% 16% 16% 9% 3% 9% 9% 9% 6% 6% 6%3% 3% 3% 3% 0% 0% Hungary Italy Germany Norway Bulgaria Portugal England Europe average Cyprus Netherlands Latvia Romania Croatia Lithuania Malta Greece Sweden Scotland Finland France Slovakia Czech Slovenia Ireland Estonia Spain Poland Austria Belgium Denmark Luxembourg The percentage of products that have been filed for P&R varies significantly with a higher percentage in larger European markets, than in smaller markets, particularly Central and Eastern Europe Reimbursed Filed for P&R Not filed for P&R No information 6 Abbreviations: P&R = pricing and reimbursement
Speed of marketing authorisation Status of filing and reimbursement Speed of filing and reimbursement Root causes of delays While there are delays in P&R filing for some products, this is not a key driver of low availability of medicines in all countries Key findings: Speed of filing and reimbursement Proportion of time to reimbursement due to time to file for P&R Sample size (total = 32) 5 3 4 12 4 5 9 9 6 7 7 3 7 7 8 7 11 7 11 6 7 5 3 8 7 8 6 8 Although the Portal contains products that have been on the market for different lengths of time, across products that have been successfully reimbursed: 39% 35% 33% 34% 34% 31%31%33% 30%30% 30% 28%29% 25%26% o 25% of the total time between EMA approval and availability can be attributed to the time between receiving EMA marketing authorization and P&R filing 25% 23% 24%25% 21%22% 18% 18% 17%18% 14%15% 12% o 75% of this time is attributable to the time between P&R filing and P&R decisions at the country-level 9% Norway Italy Hungary Malta Luxembourg Greece Ireland Slovenia Finland Estonia Cyprus France Sweden Scotland Austria Spain Czech Poland Netherlands Bulgaria Latvia Romania Lithuania Croatia Belgium Slovakia Europe average Portugal Denmark This pattern varies across countries: the proportion of the total time taken up by the time it takes a company to file for P&R is lowest in EU4+UK markets (19%) and highest in CEE (27%) Note: Data are not available for all products in all countries. Where the sample size of products in any given country was less than 3 (Germany and England), these countries have been removed from the figure. This is due to the risk of bias in the results from a very small number of products and due to the risk of de-anonymising individual products. 7 Abbreviations: CEE = Central and Eastern Europe; P&R = pricing and reimbursement
Speed of marketing authorisation Status of filing and reimbursement Speed of filing and reimbursement Root causes of delays As set out in the root causes analysis, the reasons for both delays in P&R filing and P&R decision making are multi-factorial Key findings: Reasons for not filing for P&R Proportion of time to reimbursement due to time to file for P&R The most common reasons for not filing for P&R were related to the requirements of the P&R process and health system constraints and resources 110 105 Health system constraints and resources P&R process Value assessment process Number of times this reason was provided 100 However, these reasons clearly vary between regions of Europe: 90 Preparing to file 80 Delays in filing in Western Europe are largely due to the value assessment process and evidence requirements o 70 60 50 Delays in filing in Central and Eastern Europe are largely due to health system constraints and the corresponding impact this has on commercial decision- making and resource allocation o 40 28 26 30 25 20 12 12 7 The data collected in the Portal will mature as more cycles of data are collected. This will allow us to validate some of these early results and to look in more detail at the underlying root causes 6 10 4 3 3 2 2 2 1 0 0 CEE Mid-size Western Nordic EU4+UK 8 Abbreviations: CEE = Central and Eastern Europe; P&R = pricing and reimbursement
Speed of marketing authorisation Status of filing and reimbursement Speed of filing and reimbursement Root causes of delays There is significant variation in the reason certain products have not filed for reimbursement in all European countries This grid shows that there is significant variation across products. This is, in part, due to the length of time since the marketing authorization, but also because of the different types of product included Anonymised distribution of product-level P&R filing across countries Anonymised product-level information (N=32) Netherlands Germany Spain Italy England Denmark Finland Sweden Belgium Portugal Austria France Ireland Luxembourg Scotland Czechia Greece Slovenia Norway Slovakia Bulgaria Poland Romania Hungary Estonia Croatia Lithuania Cyprus Latvia Malta 88% 84% 84% 81% 78% 75% 75% 75% 72% 72% 69% 66% 66% 59% 59% 56% 56% 56% 53% 47% 44% 44% 44% 38% 34% 31% 28% 25% 19% 13% The reason for delayed filing varied from product to product. For some groups of products, the impact of external reference pricing was a key driver. In other cases, country filing requirements was listed as one of the reasons for non-submission 100% 97% 93% 90% 83% 80% 80% 80% 80% 77% 73% 70% 70% 70% 67% 63% 60% 60% 53% 47% 43% 43% 43% 40% 37% 37% 20% 20% 13% 10% 3% 0% 9
Key conclusions of the first European Access Hurdles Portal report There is a willingness from industry to provide more transparency on the root causes of unavailability, with almost 90% of eligible EFPIA companies submitting data to the Portal The data collected in the Portal has generated new insights on delay and lack of availability: 1. 2. Speed of marketing authorisation Status of filing and reimbursement Speed of filing and reimbursement Root causes of delays Even before considering the P&R process, new products received regulatory approval later in Europe than in other regions In many instances of product unavailability, the products have in fact been filed for reimbursement but have not yet been reimbursed While there are delays in P&R filing for some products in some countries, this is not a key driver of low availability of medicines in all countries The reasons for both delays in P&R filing and P&R decision-making are multi-factorial, commonly relating to requirements of the P&R process and health system constraints 3. These findings indicate that availability of centrally authorized medicines to patients in European countries is a shared responsibility, requiring a shared solution This is the first report from the Portal; thus, the data are exploratory and cannot be used to infer the impact of EFPIA members commitment to file. The data collected in the Portal will mature as more cycles of data are collected. This will allow us to validate some of these early results and to look in more detail at the underlying root causes 4. 10