Insights into Learning Disability Trends in South Tyneside
Explore the evolving trends in learning disabilities among different age groups in South Tyneside from 2014 to 2030, including predictions for populations, challenges, and service utilization.

Download Presentation

Please find below an Image/Link to download the presentation.
The content on the website is provided AS IS for your information and personal use only. It may not be sold, licensed, or shared on other websites without obtaining consent from the author. If you encounter any issues during the download, it is possible that the publisher has removed the file from their server.
You are allowed to download the files provided on this website for personal or commercial use, subject to the condition that they are used lawfully. All files are the property of their respective owners.
The content on the website is provided AS IS for your information and personal use only. It may not be sold, licensed, or shared on other websites without obtaining consent from the author.
E N D
Presentation Transcript
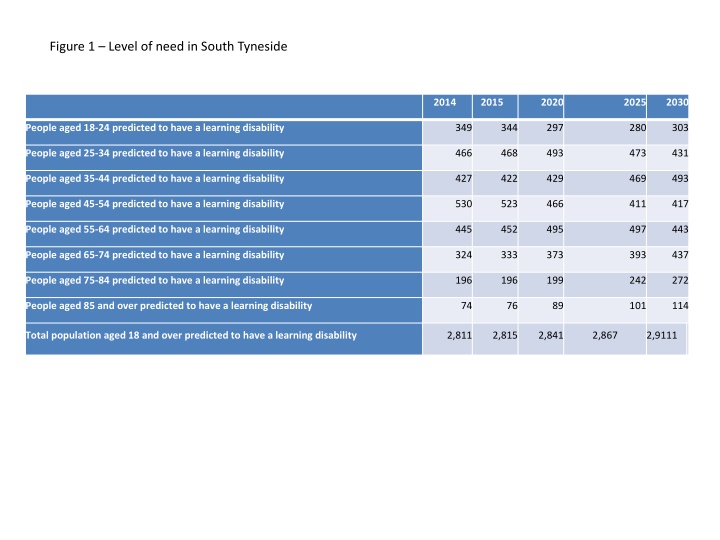
Figure 1 Level of need in South Tyneside 2014 2015 2020 2025 2030 People aged 18-24 predicted to have a learning disability 349 344 297 280 303 People aged 25-34 predicted to have a learning disability 466 468 493 473 431 People aged 35-44 predicted to have a learning disability 427 422 429 469 493 People aged 45-54 predicted to have a learning disability 530 523 466 411 417 People aged 55-64 predicted to have a learning disability 445 452 495 497 443 People aged 65-74 predicted to have a learning disability 324 333 373 393 437 People aged 75-84 predicted to have a learning disability 196 196 199 242 272 People aged 85 and over predicted to have a learning disability 74 76 89 101 114 Total population aged 18 and over predicted to have a learning disability 2,811 2,815 2,841 2,867 2,9111
Figure 2 Age Range (%) Age range % 2011 2021 15-19 2.67 2.67 20-24 2.69 2.71 25-29 2.49 2.49 30-34 2.49 2.49 35-39 2.45 2.46 40-44 2.45 2.47 45-49 2.28 2.31 50-54 2.37 2.39 55-59 2.33 2.32 60-64 2.2 2.22
Figure 3 South Tyneside Population 2015 2020 2025 2030 People aged 18-24 moderate to severe 584 583 584 588 18+ severe 132 150 125 127 Challenging behaviour 41 40 39 39 Autism 899 885 866 850 Living with a parent 181 175 173 174
Figure 4 Comparison to North East total figures 2015 2020 2025 2030 People aged 18-24 moderate to severe 8817 8739 8627 8573 18+ severe 2347 2312 2292 2294 Challenging behaviour 719 711 698 687 Autism 15,855 15,699 15,463 15,278 Living with a parent 3290 3200 3171 3218
Figure 5 - Number of people with learning disabilities known by service in South Tyneside Table 1: Number of people with Learning Disability by service in South Tyneside Number of people with Learning Disabilities known to services Age range Local Authority All age range 891 884 Quality Outcomes Framework - GP register All age range
Figure 6 Referral types to discipline within community learning disabilities team
Figure 7 Nursing referrals to South Tyneside CLDT. Number and % by main reason on referral form. 1stJanuary 2016 31stDecember 2016 (400 referrals)
Figure 8 Proportion of people with learning disabilities being offered NHS Health Checks

")