Insights into Norrkping Municipality
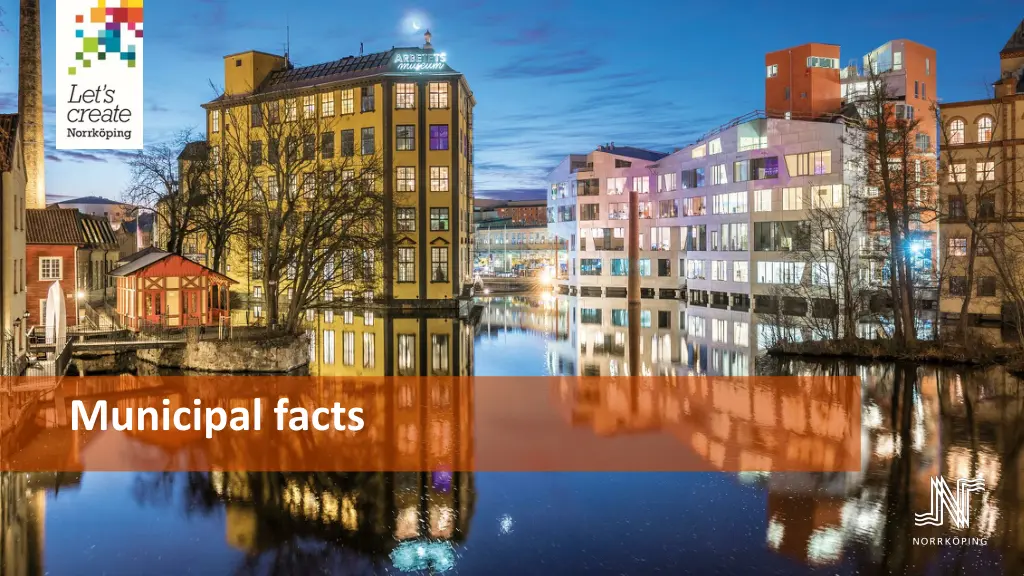
Discover key statistics and trends about Norrkping Municipality in Sweden, including population changes, demographics, and foreign-born residents. Explore data on population density, job openings, unemployment rate, and more.
Download Presentation

Please find below an Image/Link to download the presentation.
The content on the website is provided AS IS for your information and personal use only. It may not be sold, licensed, or shared on other websites without obtaining consent from the author. If you encounter any issues during the download, it is possible that the publisher has removed the file from their server.
You are allowed to download the files provided on this website for personal or commercial use, subject to the condition that they are used lawfully. All files are the property of their respective owners.
The content on the website is provided AS IS for your information and personal use only. It may not be sold, licensed, or shared on other websites without obtaining consent from the author.
E N D
Presentation Transcript
Municipality of Norrkping 2023 Area:1 495 km2 Water area: 553 km2 Population: 145 163 Population density per km2: 97 Simonstorp STERG TLAND Krokek Sv rtinge by Kvarsebo NORRK PING straHusby Sk rblacka Norsholm Ark sund STERSJ N 3 Source: Statistics Sweden
Norrkping in numbers 144 980: Number of residents the tenth largest municipality in Sweden 1) 71 415: Number of job openings 2) 80,4 %: Share of gainfully emplpyed population aged 20-64 years 2) 9,1 %: Unemployment rate (+0,2 percent units) 3) 21,1 %: Proportion of residents born abroad 1) Source: Statistics Sweden and Swedish Public Employment Service Note: 1) Refers to 2024-12-31 2) Refers to the year 2023. 3) Refers to the 12 month average year 2024, change since 2023 in parenhteses.
Norrkpings folkmngd 1950-2024 160,000 Population 31 dec 2024 144 980 72 480 140,000 120,000 72 500 100,000 80,000 10 60,000 Norrk ping is Sweden's tenth largest municipality in terms of population. 40,000 20,000 0 1950 1955 1960 1965 1970 1975 1980 1985 1990 1995 2000 2005 2010 2015 2020 Source: Statistics Sweden Note: the y-axis does not begin by the value zero.
Annually population changes 1951-2024 Number of residents 2,500 2,000 1,500 1,000 500 0 -500 -1,000 -1,500 1951 1953 1955 1957 1959 1961 1963 1965 1967 1969 1971 1973 1975 1977 1979 1981 1983 1985 1987 1989 1991 1993 1995 1997 1999 2001 2003 2005 2007 2009 2011 2013 2015 2017 2019 2021 2023 Source: Statistics Sweden
Changes in population 1968-2024 8,000 7,000 In-migration 6,000 Out-migration 5,000 Births 4,000 Deaths 3,000 2,000 1,000 0 1968 1970 1972 1974 1976 1978 1980 1982 1984 1986 1988 1990 1992 1994 1996 1998 2000 2002 2004 2006 2008 2010 2012 2014 2016 2018 2020 2022 2024 Source: Statistics Sweden
Share of foreign born population in Norrkping, Sweden and some comparable municipalities Per cent 30 Norrk ping 25 Eskilstuna 21.1 V ster s 20 Sweden rebro J nk ping 15 Link ping 10 5 0 2000 2001 2002 2003 2004 2005 2006 2007 2008 2009 2010 2011 2012 2013 2014 2015 2016 2017 2018 2019 2020 2021 2022 2023 2024 Source: Statistics Sweden
Population by country of birth (exkl. Sweden) 2000- 2023 8,000 7,000 Syria 6,000 Iraq 5,000 Bosnia & Herzegovina Finland 4,000 3,000 Somalia 2,000 Former Yugoslavia 1,000 Poland 0 2000 2001 2002 2003 2004 2005 2006 2007 2008 2009 2010 2011 2012 2013 2014 2015 2016 2017 2018 2019 2020 2021 2022 2023 2024 Source: Statistics Sweden Note: The diagram refers to the most common birth countries among the population in Norrk ping except Sweden. In 2024 there were 114 317 residents born in Sweden.
Population in Norrkping 2004, 2014 och 2024 by age Count 2004 2014 2024 2,500 2,000 1,500 1,000 500 0 0 r 10 r 20 r 30 r 40 r 50 r 60 r 70 r 80 r 90 r 100+ r lder Source: Statistics Sweden
Number of job openings Norrkping 1990-2023 80,000 71,415 70,000 66,438 60,000 50,000 40,000 30,000 20,000 10,000 0 Source: Statistics Sweden
Work-related commuting to and from Norrkping 1995-2023 Number of commuters Commuters to Norrk ping Commuters from Norrk ping 16,000 14,07814,379 14,000 12,000 10,000 8,000 6,000 4,000 2,000 0 19951996199719981999200020012002200320042005200620072008200920102011201220132014201520162017201820192020202120222023 Source: Statistics Sweden A person living in one municipality and work in another is defined as a commuter.
Number of commuters to and from the municipalities with the most frequent commuting 2023 Katrineholm 290 Stockholm 1 170 Finsp ng Nyk ping 2 390 530 510 440 820 1 990 680 3 200 3 190 5 770 Link ping 1 260 S derk ping 160 Valdemarsvik K lla: Statistiska centralbyr n (BAS)
Share of gainfully employed population 20-64 years 2000 - 2023 Per cent 100 95 90 Norrk ping Sweden 85 81.6 80 80.4 75 70 65 60 55 50 2000 2001 2002 2003 2004 2005 2006 2007 2008 2009 2010 2011 2012 2013 2014 2015 2016 2017 2018 2019 2020 2021 2022 2023 Source: Statistics Sweden Note: the y-axis does not begin by the value zero.
Unemployment rate Norrk ping Sweden Difference Per cent 16 14 12.8 12 9.1 10 8.5 8.7 8 6.8 5.0 6 4.6 4 2.3 3.5 2 0 2008 2009 2010 2011 2012 2013 2014 2015 2016 2017 2018 2019 2020 2021 2022 2023 2024 Source: Swedish Public Employment Service (12-month average for each year) Note: The umployment rate is the share of the labour force in the ages 16-65 years who are registred as unemployed
Educational level among the population, age 25-65 years Pre high school High school Post secundary school Per cent 60% 50% 43.4% 40% 42.6% 30% 20% 12.2% 10% 0% Source: Statistics Sweden
Educational level among the population, age 25-64 r Norrk ping, Sweden and some comparable municipalities, year 2023 Per cent 100% 90% 80% 70% 56.4% 60% 48.2% 48.1% 47.7% 46.7% 50% 42.6% 38.6% 40% 30% 20% 10% 0% Norrk ping Riket Eskilstuna J nk ping Link ping V ster s rebro Source: Statistics Sweden
Newly constructed homes in Norrkping 1961-2024 Dwellings in multi-dwelling buidlings One- or two dwelling buildings 2,500 2,000 1,500 1,000 539 500 0 Source: Municipality of Norrk ping 1961-1974, Statistics Sweden 1975-2024

