Insights into North Dakota's Consolidated Plan and Demographic Trends
Explore the 2020-2024 State of North Dakota Consolidated Plan, highlighting the importance of preparing a plan to address housing and community development needs. Gain valuable insights on HUD-funded programs, demographic data, and the purpose of today's focus group meeting.

Download Presentation

Please find below an Image/Link to download the presentation.
The content on the website is provided AS IS for your information and personal use only. It may not be sold, licensed, or shared on other websites without obtaining consent from the author. If you encounter any issues during the download, it is possible that the publisher has removed the file from their server.
You are allowed to download the files provided on this website for personal or commercial use, subject to the condition that they are used lawfully. All files are the property of their respective owners.
The content on the website is provided AS IS for your information and personal use only. It may not be sold, licensed, or shared on other websites without obtaining consent from the author.
E N D
Presentation Transcript
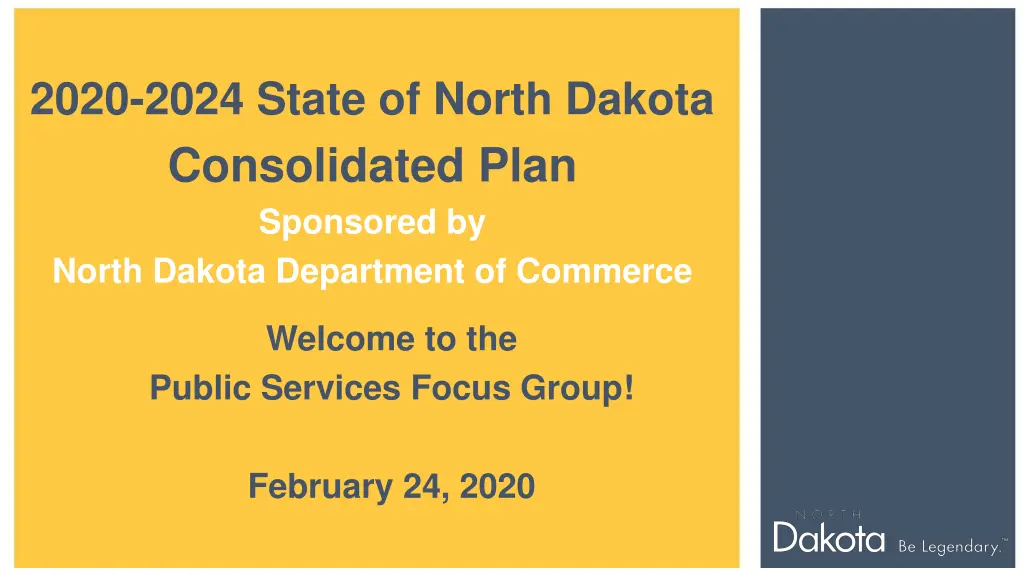
2020-2024 State of North Dakota Consolidated Plan Sponsored by North Dakota Department of Commerce Welcome to the Public Services Focus Group! February 24, 2020
Why Prepare a Consolidated Plan? In exchange for receiving HUD funds, recipients must prepare four things: 1. A Five-Year Consolidated Plan 2. Annual Action Plan 3. Performance and Evaluation Report 4. Analysis of Impediments
Purpose of the Five-Year Consolidated Plan Help us identify housing and community development needs, priorities and strategies Help us indicate how state and federal funds will be allocated to address these needs and activities over five years Annual action plan sets actions for 1st yr.
Purposes of Todays Meeting 1. Advise you of some of our findings 2. Provide us with your opinions and expertise about the housing needs in North Dakota 3. Introduce the Survey! https://www.surveymonkey.com/r/2020N orthDakota_HCDSurvey
Resources (2020) CDBG: $3,991,758 HOME: $3,000,000 ESG: $485,414 NHTF: $3,000,000
Demographics Table II.1.1 Population Estimates State of North Dakota 2010-2018 Census Data and Intercensal Estimates 2010 Census 2011 Population Estimate 2012 Population Estimate 2013 Population Estimate 2014 Population Estimate 2015 Population Estimate 2016 Population Estimate 2017 Population Estimate 2018 Population Estimate 672,591 685,136 701,116 721,999 737,382 754,022 754,353 755,176 760,077
Demographics Population by Age and Gender State of North Dakota 2010 Census and Current Census Estimates 2010 Census 2018 Estimates % Change Age 18-Oct 22.60% 4.20% 26.90% 20.10% -17.20% 15.90% 13.00% Under 14 years 15 to 24 years 25 to 44 years 45 to 54 years 55 to 64 years 65 and Over Total 124,461 106,430 90,485 75,262 96,657 81,819 672,591 152,549 110,861 114,800 90,402 80,005 94,823 760,077
Demographics Population by Race and Ethnicity State of North Dakota 2010 Census & 2018 Five-Year ACS 2010 Census 2018 Five-Year ACS Population 655,268 20,445 39,462 10,814 378 7,528 18,306 752,201 725,672 26,529 Race Population 605,449 7,960 36,591 6,909 320 3,509 11,853 672,591 659,124 13,467 % of Total 90.0% 1.2% 5.4% 1.0% 0% 0.5% 1.8% 100.0% 98.0% 2.0% % of Total 87.1% 2.7% 5.2% 1.4% 0.1% 1.0% 2.4% 100.0% 96.5% 3.5% White Black American Indian Asian Native Hawaiian/ Pacific Islander Other Two or More Races Total Non-Hispanic Hispanic
Demographics Disability by Age State of North Dakota 2018 Five-Year ACS Data Male Female Total Age Disabled Population 187 3,847 4,989 15,931 7,279 9,142 41,375 Disability Rate 0.7% 6.2% 4.8% 11.8% 25.3% 47.7% 11.0% Disabled Population 127 1,689 5,376 12,484 6,059 12,234 37,969 Disability Rate 0.5% 2.9% 5.9% 9.7% 20.7% 45.9% 10.5% Disabled Population 314 5,536 10,365 28,415 13,338 21,376 79,344 Disability Rate 0.6% 4.6% 5.3% 10.8% 23.0% 46.7% 10.8% Under 5 5 to 17 18 to 34 35 to 64 65 to 74 75 or Older Total
Homelessness Homeless Count State of North Dakota 2019 PIT Count Year 2015 2016 2017 2018 2019 Sheltered 819 707 758 494 545 Unsheltered 486 216 331 48 12 Total 1,305 923 1,089 542 557
Homelessness Homeless Count State of North Dakota 2019 PIT Count Households Type Sheltered Unsheltered Total Households without children 371 3 374 Households with adults and children 171 9 180 Households with only children 3 0 3 Total 545 12 557
Economics Households by Income State of North Dakota 2010 & 2018 Five-Year ACS Data 2010 Five-Year ACS 2018 Five-Year ACS Income Households % of Total Households % of Total Less than $15,000 $15,000 to $19,999 $20,000 to $24,999 $25,000 to $34,999 $35,000 to $49,999 $50,000 to $74,999 $75,000 to $99,999 $100,000 or More Total 39,425 16,011 16,678 32,772 41,563 55,089 34,795 40,309 276,642 14.3% 5.8% 6.0% 11.8% 15.0% 19.9% 12.6% 14.6% 100.0% 31,291 13,158 12,633 27,910 39,929 57,047 45,061 87,874 314,903 9.9% 4.2% 4.0% 8.9% 12.7% 18.1% 14.3% 27.9% 100.0%
Economics Poverty by Age State of North Dakota 2000 Census SF3 & 2018 Five-Year ACS Data 2000 Census 2018 Five-Year ACS Persons in Poverty 8,604 12,258 48,920 9,488 79,270 10.9% Age Persons in Poverty 8,173 13,990 41,568 9,726 73,457 11.9% % of Total 10.9% 15.5% 61.7% 12.0% 100.0% . % of Total Under 6 6 to 17 18 to 64 65 or Older Total Poverty Rate 11.1% 19.0% 56.6% 13.2% 100.0% .
Economics Poverty Rates State of North Dakota SAIPE Estimates 2000 2017
Economics Annual Unemployment Rate State of North Dakota 1990 2018 BLS Data
Economics Real Average Earnings per Job State of North Dakota
Housing Housing Units by Type State of North Dakota 2010 & 2018 Five-Year ACS Data 2010 Five-Year ACS Units 208,028 7,192 12,538 61,360 23,719 2018 Five-Year ACS Units 231,666 7,608 14,120 87,402 26,767 Unit Type % of Total 66.5% 2.3% 4.0% 19.6% 7.6% % of Total 63.0% 2.1% 3.8% 23.8% 7.3% Single-Family Duplex Tri- or Four-Plex Apartment Mobile Home Boat, RV, Van, Etc. Total 24 0% 121 0% 312,861 100.0% 367,684 100.0%
Housing Housing Units by Tenure State of North Dakota 2010 Census & 2018 Five-Year ACS Data 2010 Census 2018 Five-Year ACS Tenure Units 281,192 % of Total 88.6% Units 314,903 % of Total 85.6% Occupied Housing Units Owner-Occupied 183,943 65.4% 197,347 62.7% Renter-Occupied 97,249 34.6% 117,556 37.3% Vacant Housing Units 36,306 11.4% 52,781 14.4% Total Housing Units 317,498 100.0% 367,684 100.0%
Housing Households by Year Home Built State of North Dakota 2010 & 2018 Five-Year ACS Data 2010 Five-Year ACS Households 44,468 13,577 29,365 30,162 61,690 36,021 32,465 28,894 . 276,642 2018 Five-Year ACS Households 38,564 13,239 28,124 28,934 57,926 36,404 35,167 38,431 38,114 314,903 Year Built % of Total 16.1% 4.9% 10.6% 10.9% 22.3% 13.0% 11.7% 10.4% . 100.0% % of Total 12.2% 4.2% 8.9% 9.2% 18.4% 11.6% 11.2% 12.2% 12.1% 100.0% 1939 or Earlier 1940 to 1949 1950 to 1959 1960 to 1969 1970 to 1979 1980 to 1989 1990 to 1999 2000 to 2009 2010 or Later Total
Housing Disposition of Vacant Housing Units State of North Dakota 2010 Census & 2018 Five-Year ACS Data 2010 Census Units 7,422 2,734 554 1,043 2018 Five-Year ACS Units 12,502 3,054 2,694 1,297 Disposition % of Total 20.4% 7.5% 1.5% 2.9% % of Total 23.7% 5.8% 5.1% 2.5% For Rent For Sale Rented Not Occupied Sold Not Occupied For Seasonal, Recreational, or Occasional Use For Migrant Workers Other Vacant Total 11,483 31.6% 15,898 30.1% 319 12,751 36,306 0.9% 35.1% 100.0% 858 16,478 52,781 1.6% 31.2% 100.0%
Housing Single-Family Permits State of North Dakota Census Bureau Data, 1980 2018
Housing Total Permits by Unit Type State of North Dakota Census Bureau Data, 1980 2018
Housing Median Rent State of North Dakota 2018 Five-Year ACS Data Place Rent Median Rent $722 Median Home Value $185,000
Housing Problems Cost Burden and Severe Cost Burden by Tenure State of North Dakota 2010 & 2018 Five-Year ACS Data 31%-50% Households % of Total Households % of Total Owner With a Mortgage 2010 Five-Year ACS 15,888 2018 Five-Year ACS 12,073 Owner Without a Mortgage 2010 Five-Year ACS 5,927 2018 Five-Year ACS 4,466 Above 50% Data Source Total 15.80% 11.50% 5,981 5,573 5.90% 5.30% 100,620 104,979 7.10% 4.80% Renter 18.10% 18.40% Total 13.90% 12.10% 4,307 3,968 5.20% 4.30% 83,497 92,368 2010 Five-Year ACS 2018 Five-Year ACS 16,711 21,605 17,299 20,358 18.70% 17.30% 92,525 117,556 2010 Five-Year ACS 2018 Five-Year ACS 38,526 38,144 27,587 29,899 10.00% 9.50% 276,642 314,903
What we are doing: Housing and Community Development Survey Three Focus Groups: Affordable Housing, Homelessness, Public Services Regional Public Input Meetings Public Review Meeting
Public Service Needs: What groups of people at most in need? What types services do households need in North Dakota?
Community Needs What challenges do service providers face in meeting needs? What can the State do to help meet the needs of households and service providers?
Community Input What is the State doing well to address community needs? What programs or efforts can be improved? Other comments?
What is coming up: February 24 Focus Groups Regional Community Meetings Public Review Meeting
Consolidated Plan Contact: Bonnie Malo Director Division of Community Services 701.328.2476 bmalo@nd.gov


")