Explore the downward trend of tobacco use in Oregon from 1993 to 2014 and the persistent disparities in smoking rates among diverse communities. Learn about initiatives like the Tobacco Prevention and Education Program, challenges faced by specific groups, and the increasing diversity of Oregon's population.
Please find below an Image/Link to download the presentation.
The content on the website is provided AS IS for your information and personal use only. It may not be sold, licensed, or shared on other websites without obtaining consent from the author. If you encounter any issues during the download, it is possible that the publisher has removed the file from their server.
You are allowed to download the files provided on this website for personal or commercial use, subject to the condition that they are used lawfully. All files are the property of their respective owners.
The content on the website is provided AS IS for your information and personal use only. It may not be sold, licensed, or shared on other websites without obtaining consent from the author.
E N D
Presentation Transcript
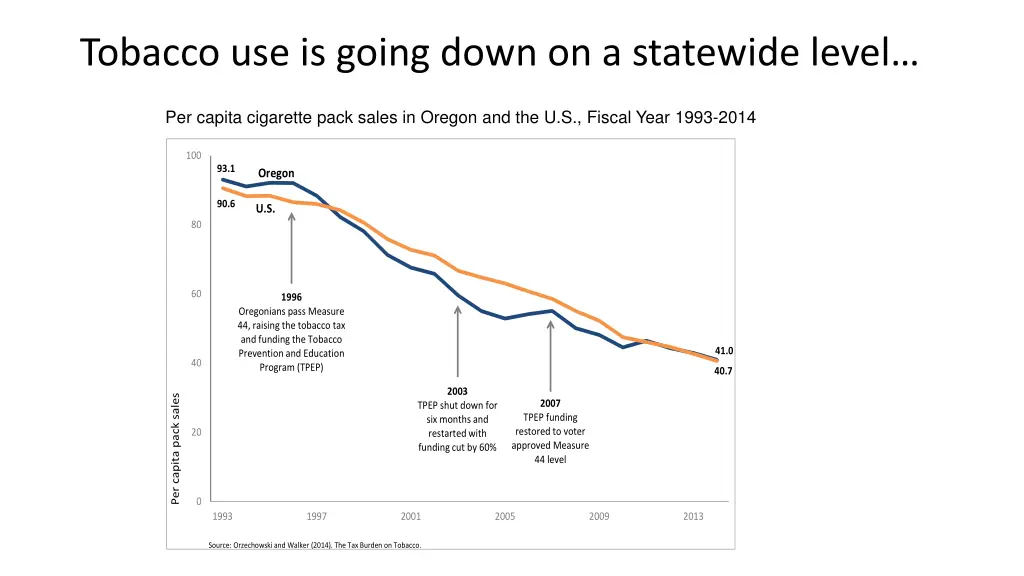
Tobacco use is going down on a statewide level Per capita cigarette pack sales in Oregon and the United States, Fiscal Year 1993 2014 Per capita cigarette pack sales in Oregon and the U.S., Fiscal Year 1993-2014 100 93.1 Oregon 90.6 U.S. 80 60 1996 Oregonians pass Measure 44, raising the tobacco tax and funding the Tobacco Prevention and Education Program (TPEP) 41.0 40 40.7 2003 Per capita pack sales 2007 TPEP shut down for six months and restarted with funding cut by 60% TPEP funding restored to voter approved Measure 44 level 20 0 1993 1997 2001 2005 2009 2013 Source: Orzechowski and Walker (2014). The Tax Burden on Tobacco.
yet many communities still experience tobacco-related health inequities. Examples of smoking rates for specific groups: People with mental health and addictions disorders: up to 90% Homeless population: 80% Inmates of US prisons and jails: 70-80% American Indians and Alaska Natives: 35% African Americans: 33% Rural communities (e.g. Lincoln county): 33% Oregon Health Plan members: 31% Sources: 1. Grant et al., 2004; Lasser et al., 2000; Morris, Waxmonsky, May, & Giese, 2009; Williams & Zeidonis, 2004. 2. Smoking among chronically homeless adults: prevalence and correlates. Psychiatric Services. 2012. http://www.ncbi.nlm.nih.gov/pubmed/22476200 3. Tobacco Control Legal Consortium. Tobacco in adult correctional facilities: a policy overview. 2012. http://publichealthlawcenter.org/sites/default/files/resources/tclc-fs-tobacco-adultcorrections-2012_0.pdf 4. Behavioral Risk Factor Surveillance System, Race Oversample. 2010-2011. Estimates are age-adjusted. 5. Behavioral Risk Factor Surveillance System, 2010-2013 county combined data set; age-adjusted to the 2000 standard population 6. Behavioral Risk Factor Surveillance System, 2014. Estimates are age-adjusted. Notes: The first three bullets are national estimates and should be interpreted with caution. 2014 BRFSS data on the Medicaid smoking rate is compared to non OHP members.
Oregons population is increasingly diverse Racial/Ethnic Diversity Count by Census Tract Source: http://arcg.is/1QX8WCw 2014 American Community Survey Census Tracts: 5 Year Estimates
Small Group Activity 1. Break into small groups (30 min) each group should include participants from a mix of regions. Use the discussion guide to answer questions. 2. Report back highlights from small groups (5 min).