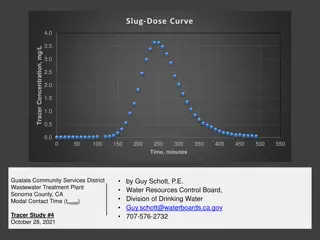
Insights into Tracer Study for Underground Nuclear Explosions
Examining the utilization of various tracers like H2O, radon, and CO2 to detect underground nuclear explosions. The study focuses on observations at the nuclear test site and monitoring site, along with modeling configurations and outputs. Various factors such as porosity, fractures, and other petrophysical properties are considered for analysis.

Download Presentation

Please find below an Image/Link to download the presentation.
The content on the website is provided AS IS for your information and personal use only. It may not be sold, licensed, or shared on other websites without obtaining consent from the author.If you encounter any issues during the download, it is possible that the publisher has removed the file from their server.
You are allowed to download the files provided on this website for personal or commercial use, subject to the condition that they are used lawfully. All files are the property of their respective owners.
The content on the website is provided AS IS for your information and personal use only. It may not be sold, licensed, or shared on other websites without obtaining consent from the author.
E N D
Presentation Transcript
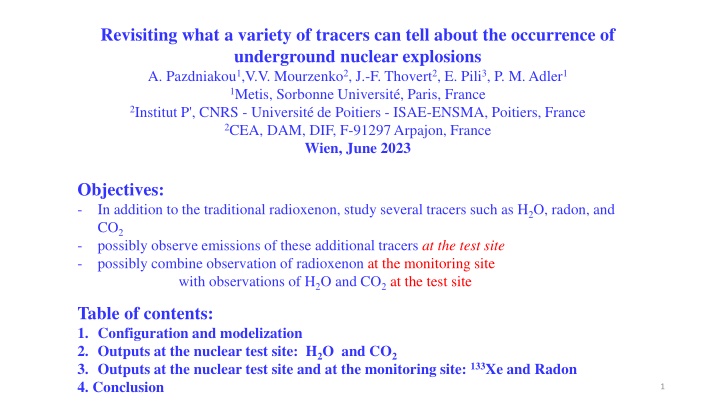
Revisiting what a variety of tracers can tell about the occurrence of underground nuclear explosions A. Pazdniakou1,V.V. Mourzenko2, J.-F. Thovert2, E. Pili3, P. M. Adler1 1Metis, Sorbonne Universit , Paris, France 2Institut P', CNRS - Universit de Poitiers - ISAE-ENSMA, Poitiers, France 2CEA, DAM, DIF, F-91297 Arpajon, France Wien, June 2023 Objectives: - In addition to the traditional radioxenon, study several tracers such as H2O, radon, and CO2 - possibly observe emissions of these additional tracers at the test site - possibly combine observation of radioxenon at the monitoring site with observations of H2O and CO2at the test site Table of contents: 1. Configuration and modelization 2. Outputs at the nuclear test site: H2O and CO2 3. Outputs at the nuclear test site and at the monitoring site: 133Xe and Radon 4. Conclusion 1
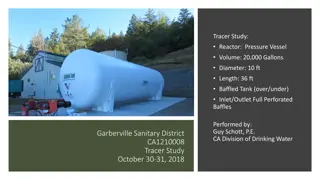
1. Configuration and modelization Nuclear test site: Punggye-Ri nuclear test site (DPRK) a parallelipipedon of size 200 200 650 m Ground surface Fluctuating atmospheric pressure period 105 s; amplitude 1000 Pa. Embedding porous medium: Permeability Km=10-16 m2 porosity m = 0.01 or 0.05 Fracture network 192 or 384 fractures aperture b = 1 mm hexagons of radius R=20m Simplified structure: Permeability: K=10-14 m2 porosity = 0.29 T=802.15 K 3 initial pressures P0 =50, 100, 200 bars Chimney Cavity Magma 2 Patriarche et al, Stereological analysis of fractures in the Roselend tunnel and permeability determination. Water Resources Research, 43: W09421
Modelization: Pazdniakou et al. (2022), Two-Phase Flow, Heat and Mass Transfer and Tracer Transport to the Atmosphere from Underground Nuclear Cavities Through Fractured Porous Media. Pure and Applied Geophysics. Porous medium - 3D equations on the Darcy scale for flow, energy and tracer Fractures - 2D equations on the Darcy scale for flow, energy and tracer plus exchanges with the surrounding porous medium Numerical - Meshing of the fractures (and all the bounding surfaces) by triangles, and of the porous medium by tetrahedra - Discretization by the finite volume technique - Solution by the conjugate gradient method - Parallelization by OpenMP Results: - at the test site (Punggye-Ri, DPRK) for an hypothetical 150 kt nuclear explosion, burried at 550 m - at the monitoring site (IMS JPX38-Takasaki, Japan): includes a delay = 1 day and a dilution factor = 7 10-18 s m-3 (see presentation O2.1-118 by Pili et al. on Thursday) 3
2. Outputs at the nuclear test site 2.1. H2O - Initial mass of water contained in the cavity 5000 T (sphere of radius 50 m; porosity 0.01) Fractured porous medium with 192 fractures and porosity 0.05 Three initial cavity pressures after the collapse of the cavity roof and the formation of the chimney: P0 = 50 bars 100 bars 200 bars Total mass transferred to the atmosphere Mass flow rate Detectable by satellite imaging? To be compared with the 600 T contained in a standard atmospheric column of 1000 mhigh above the test site, i.e. 15.5 g/m3 4
Influence of the petrophysical properties of the surrounding medium When the porosity decreases, the initial mass flow rate increases When the number of fractures increases, the initial mass flow rate increases Nuclear test site Nuclear test site For P0 = 100 bars Convention Porosity Number of fractures blue 0.05 192 red 0.01 192 black 0.05 384 broken red 0.01 384 5
Comparison with an homogeneous model: The fractured porous medium with = 0.05 and Nf= 192 is replaced by an equivalent homogeneous medium: permeability K=6.48 10-13 m2and porosity =0.05 P0= 100 bars 6 Delay to fill in the porosity!
Comparison between the fractured porous medium model (solid line) and the homogeneous one (broken line): P0=100 bars =0.05 Nf=192 Orders of magnitude conserved! 7
2.2. CO2 Initially contained in a 10 m thick soil layer at the top of the medium No fracture in this soil layer Other properties of this layer: permeability = 10-12 m2, porosity = 0.3 Diffusion coefficient calculated according to Archie s law Mass flow rate at the ground surface: 300 mg/m2/hour Initial mass fraction (corresponds to equilibrium): 7.6 10-2 No source term in these preliminary calculations 8
Additional CO2 mass transferred to the atmosphere: CO2 mass Mc1 transferred to the atmosphere DMc1(t) = Mc1-mass transferred with no test P0= 200 bars 100 bars 50 bars Detectable by satellite imaging? atmospheric pressure fluctuations To be compared with mass transferred to the atmosphere during 12 hours =144 kg 9
Actually the tracer fluxes at the ground surface are very localized though they are significantly smoothed out by the soil layer 10
3. Outputs at the nuclear site and at the monitoring site 3.1. Radon = 0.01 Nf=192 P0 = 100 bars Nuclear test site Convention Thin line = radon originated in the porous medium Medium line = radon originated in the cavity Thick line = sum 11
Monitoring site with 6 hours sampling Desintegration number per 6 hours at the monitoring site: delay = 1 day t-1 = 1.5428 10-6 s-1 = 7 10-18 s m-3 Convention Thin line = radon originated in the porous medium Medium line = radon originated in the cavity Thick line = sum Order of magnitude of the ambiant value 50 Bq/s hopeless 12
3.2. 133Xe Initially produced in the cavity: 1 mole, i.e. 133 g; dilution coefficient =7 10-18 =0.05 Nf=192 fractures for the three values of P0 At the nuclear test site At the monitoring site with 6 hours sampling 1 mn 1h 1d 1 w detection limit MDC133Xe ~0,15 mBq/m3 for SAUNA III with a 6-hour sampling time (installed at JPX38), see Aldener et al. (2023) ~0,2 mBq/m3 for SPALAX NG with a 8-hour sampling time, see Topin et al. (2020). 13
4. Concluding remarks - Radon cannot be detected at the monitoring site - H2O and CO2 outbursts could possibly be detected at the test site by satellite imaging depending on sensitivity One day later, 133Xe could be easily detected 1000 km away at the monitoring site considering the following scenario: 150 kt underground explosion at 550 m depth in a granitic rock with a fracture network developed from the top of the chimney after cavity collapse - 14


, Two-Phase Flow,")