Insights into WIOA Performance Measurement and Data Reporting
This document provides valuable insights into the WIOA performance measurement, data collection, reporting, negotiations, and outcomes presentation to the State Workforce Development Board. It covers objectives, core programs and partners, data collection requirements, performance indicators, and more. The content emphasizes the significance of collecting various data elements and reporting on jobseeker and employer outcomes as per WIOA regulations.

Download Presentation

Please find below an Image/Link to download the presentation.
The content on the website is provided AS IS for your information and personal use only. It may not be sold, licensed, or shared on other websites without obtaining consent from the author. If you encounter any issues during the download, it is possible that the publisher has removed the file from their server.
You are allowed to download the files provided on this website for personal or commercial use, subject to the condition that they are used lawfully. All files are the property of their respective owners.
The content on the website is provided AS IS for your information and personal use only. It may not be sold, licensed, or shared on other websites without obtaining consent from the author.
E N D
Presentation Transcript
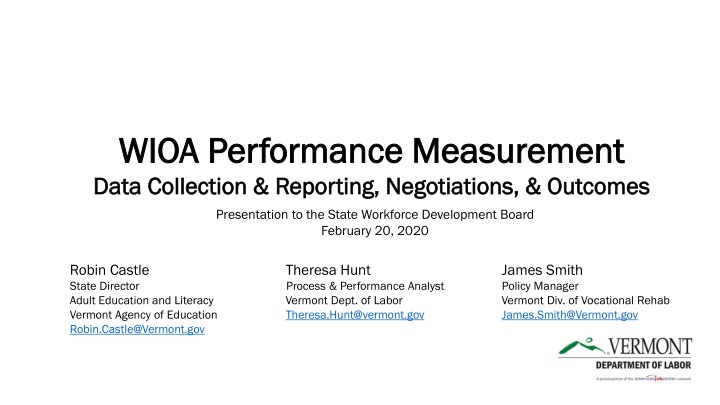
WIOA Performance Measurement WIOA Performance Measurement Data Collection & Reporting, Negotiations, & Outcomes Data Collection & Reporting, Negotiations, & Outcomes Presentation to the State Workforce Development Board February 20, 2020 Robin Castle State Director Process & Performance Analyst Adult Education and Literacy Vermont Dept. of Labor Vermont Div. of Vocational Rehab Vermont Agency of Education Theresa.Hunt@vermont.gov Robin.Castle@Vermont.gov Theresa Hunt James Smith Policy Manager James.Smith@Vermont.gov
Todays Objectives Today s Objectives Overview of the WIOA Core Programs Data Collection and Reporting Performance Indicators The Negotiation Process Recent Performance Outcomes
WIOA Core Programs and Partners WIOA Core Programs and Partners Title Program Name Administered by Title I WIOA Adult, Dislocated Worker and Youth VT Department of Labor Title II Adult Education and Family Literacy Act (AEFLA) VT Agency of Education Title III Wagner-Peyser VT Department of Labor Title IV Vocational Rehabilitation VT Agency of Human Services
WIOA Data Collection and Reporting WIOA Data Collection and Reporting o The WIOA partners are each required to collect over 80 common data on each participant served by their programs. over 80 common data elements o At a high level, the common data elements consist of: o Age o Race o Veteran status o Education level at program entry o Family size o Basic skills deficient o English language learners o Homeless o Foster Care o Enrolled in secondary education o Participated in post-secondary education o Low income status o Types of services provided, dates and completion status o Credential attainment and dates o Credential type o Enrollment in post-exit training or education program o Co-enrollment information o Post-exit quarterly wages
Beyond the 80 common data elements, the core programs must also collect additional data on everyone served in those programs, plus co-enrollment information on partner programs. Other WIOA partners include*: o Trade Adjustment Assistance program (TAA) o Jobs for Veterans State Grant (JVSG) o Apprenticeship o National Dislocated Worker Grants o Youth Build o Job Corp *Not a complete list There are over 400 data elements in total!
WIOA Performance Indicators WIOA Performance Indicators o WIOA requires states to report on both jobseeker and employer outcomes both jobseeker and employer outcomes. o There are six primary indicators of performance six primary indicators of performance defined in the federal regulations. Five are specific to jobseekers. One is geared towards employers. o Performance indicators are based on program years. o A program year begins on July 1st and ends June 30th.
Jobseeker Indicators of Performance Description Employment Rate, Second Quarter after Exit The percentage of participants who are in unsubsidized employment during the second quarter after exit from the program. 1 Same as above, related to the fourth quarter after exit.1 Employment Rate, Fourth Quarter after Exit Median Earnings, Second Quarter after Exit The median earnings of participants who are in unsubsidized employment during the second quarter after exit from the program. Credential The percentage of participants enrolled in a training or education program who attained an industry-recognized credential during participation or within one year after exiting the program. 2 Measurable Skill Gains The percentage of active program participants engaged in a training or education program during the program year who demonstrate a skill gain defined as academic, technical, occupational or other forms of progress toward a credential or employment. 1 If the individual is in the military or a registered apprenticeship program, this counts as a positive outcome. Additionally, for Youth only, engagement in an education or training program also results in a positive outcome for the quarter indicated. 2 Some caveats exist depending on whether the education program is secondary or post-secondary. Additionally, not all training programs are included in this measure.
The sixth Primary Indicator of Performance is specific to employers agencies are piloting three approaches to measure this indicator. States are required to report on two of the three approaches in the pilot period. employers. For the WIOA core programs, the federal Effectiveness in Serving Employers Measure Description Vermont has chosen: Retention with the Same Employer The percentage of participants who are employed with the same employer in the second and fourth quarters after exiting the program. Yes Repeat Business Customer The percentage of repeat employers using services within the three previous program years. Yes Employer Penetration Rate The percentage of employers who are using program services out of all employers represented in the state.1 No 1The number of employers is defined by the Bureau of Labor Statistics Quarterly Census of Earnings and Wages program (BLS QCEW).
WIOA Negotiation Process WIOA Negotiation Process o Each WIOA program s performance rates are negotiated every two years. negotiated every two years. o The WIOA partners are currently working on establishing performance rates to include in the State Plan for Program Years 2020 and 2021. o Final negotiations will conclude prior to the beginning of Program Year 2020 (July 1st, 2020).
Negotiation tools can include: Negotiation tools can include: Historical data Current economic conditions Planned state initiatives to serve individuals with barriers to employment or placement in specific industries A Statistical Adjustment Model produced by the federal government for each state. *Note, the adjustment model for 2020 and 2021 negotiations *Note, the adjustment model for 2020 and 2021 negotiations have not yet been released have not yet been released
The following slides depict the performance rates to be negotiated by the state agency listed. Some rates are marked as baseline collecting data in order to negotiate rates in the future. This means that agencies collect and report on the measure; but are not held to a performance target. baseline as the federal agencies are still
Program Years 2020 and 2021 for Title I and III Program Years 2020 and 2021 for Title I and III: Performance Measure WIOA Adult WIOA Dislocated Worker WIOA Youth WIOA Wagner-Peyser Employment Rate, Second Quarter after Exit Yes Yes Yes Yes Employment Rate, Fourth Quarter after Exit Yes Yes Yes Yes Median Earnings, Second Quarter after Exit Yes Yes Yes Yes Credential Rate Yes Yes Yes N/A Measurable Skill Gains Yes Yes Yes N/A Effectiveness in Serving Employers Baseline Baseline Baseline Baseline
Title II: Adult Education and Family Literacy Act Title II: Adult Education and Family Literacy Act Performance Measure 2020 2021 Employment Rate, Second Quarter after Exit Yes Yes Employment Rate, Fourth Quarter after Exit Yes Yes Median Earnings, Second Quarter after Exit Yes Yes Credential Rate Yes Yes Measurable Skill Gains Yes Yes Effectiveness in Serving Employers Baseline Baseline
Title IV : Vocational Rehabilitation Title IV : Vocational Rehabilitation Performance Measure 2020 2021 Employment Rate, Second Quarter after Exit Baseline Baseline Employment Rate, Fourth Quarter after Exit Baseline Baseline Median Earnings, Second Quarter after Exit Baseline Baseline Credential Rate Baseline Baseline Measurable Skill Gains Yes Yes Effectiveness in Serving Employers Baseline Baseline
Recent Performance Outcomes Recent Performance Outcomes Title II: Adult Title II: Adult Education and Education and Literacy Literacy Agency of Agency of Education Education
WIOA Performance Measures PY 2017 Actual PY 18 Goals PY 18 Actual WIOA Title I Adult Participants Served 282 275 Employment (Second Quarter after Exit) 74.1% 70.0% 72.7% Employment (Fourth Quarter after Exit) 60.0% 64.0% 63.5% Median Earnings $ 5,045.00 $ 4,530.00 $ 6,154.00 Title I: Title I: Adult, Adult, Dislocated Dislocated Worker and Worker and Youth Youth Credential Attainment Rate 73.8% 61.0% 64.5% Measurable Skills Gains 40.8 baseline 71.7% WIOA Title I Dislocated Worker Participants Served 81 95 Employment (Second Quarter after Exit) 89.6% 78.0% 88.9% Employment (Fourth Quarter after Exit) 75.6% 73.0% 78.1% Department Department of Labor of Labor Median Earnings $ 10,606.00 $ 8,051.00 $ 10,493.00 Credential Attainment Rate 81.3% 61.0% 73.2% Measurable Skills Gains 34.5 baseline 73.9% WIOA Title I Youth Participants Served 302 337 Employment (Second Quarter after Exit) 62.3% 50.0% 72.4% Employment (Fourth Quarter after Exit) 57.1% 50.0% 59.2% Median Earnings $ 3,138.00 baseline $ 4,209.00 Credential Attainment Rate 35.0% 35.5% 56.4% Measurable Skills Gains 20.5 baseline 52.3%
PY 2017 Actual WIOA Performance Measures PY 18 Goals PY 18 Actual Title III: Title III: Wagner Wagner- - Peyser Peyser WIOA Title III Wagner-Peyser 5857 1 65.1% 57.6% 5,326.00 $ Participants Served Employment (Second Quarter after Exit) Employment (Fourth Quarter after Exit) Median Earnings 9188 64.7% 58.5% 65.0% 58.0% Department Department of Labor of Labor 4,927.00 $ 5,000.00 $ 1 The drop in participants served under W-P between 2017 and 2018 are due to services provided in 2017 that no longer made the individual a participant in 2018. Referral services to partner programs or community supportive services, intake/orientation services, and the provision of labor market information are a few examples. Those individuals not considered participants are captured as Reportable Individuals. Reportable Individuals also include self-service only job seekers. As of 2/18/20, W-P shows 5,038 Participants and 7,400 Reportable Individuals for PY 2019.
In Conclusion In Conclusion 1. There are many moving parts around data collection, measurement, and performance. 2. A lot of data provides valuable information to inform strategies that focus attention and efforts on how to : Best serve Vermont s Jobseekers and Employers Best serve Vermont s Jobseekers and Employers Evaluate the effectiveness of services, supports, and programs Evaluate the effectiveness of services, supports, and programs THANK YOU! THANK YOU!