Insights on Death: A Longitudinal Examination
Explore the various aspects of death longitudinally, delving into the certainty, census-based linkages, and characteristics of unlinked death records. Gain knowledge on death statistics and trends, shedding light on mortality patterns and data quality.

Download Presentation

Please find below an Image/Link to download the presentation.
The content on the website is provided AS IS for your information and personal use only. It may not be sold, licensed, or shared on other websites without obtaining consent from the author. If you encounter any issues during the download, it is possible that the publisher has removed the file from their server.
You are allowed to download the files provided on this website for personal or commercial use, subject to the condition that they are used lawfully. All files are the property of their respective owners.
The content on the website is provided AS IS for your information and personal use only. It may not be sold, licensed, or shared on other websites without obtaining consent from the author.
E N D
Presentation Transcript
Ten things you need to know about death ..longitudinally speaking Census.ac.uk de mort O Reilly
Possible census-based linkages & analyses a b c Census 1 Census 2
Possible census-based linkages & analyses a b c Census 1 Census 2
Death has a lot going for it Statutory obligation; therefore complete and good quality data Long experience of use One of the main reasons for starting ONS-LS Aim: to highlight some caveats with the data
1. Death is not necessarily certain There are known unknowns. That is to say, there are things that we know we don't know. Rumsfeld
1. Death is not necessarily certain Some deaths are not linked Who are these immortals?
Percentage of death records not linked to a census record, by year of registration of death 12 10 Percentage unmatched 8 6 4 2 0 2001 2002 2003 2004 2005 2006 Year
Age and sex distribution of unlinked death records 1200 50 Proportion of deaths Number of deaths 45 1000 40 35 800 30 600 25 20 400 15 Males Males ales 10 200 5 Female s Females 0 0 85+ 0-4 5-9 10-14 15-19 20-24 25-29 30-34 35-39 40-44 45-49 50-54 55-59 60-64 65-69 70-74 75-79 80-84 0-4 10-14 20-24 30-34 40-44 50-54 60-64 70-74 80-84
Characteristics of those with an unlinked death record (deaths and results of log. regression) Aged less than 65 Deaths 8,130 4,941 Aged more than 65 Deaths 25,443 31,775 Sex OR 1.00 0.63 *** OR 1.00 0.92* Male Female Marital status Married Single Widowed Sep/Divorced Place of death 7,398 3,549 776 1,348 1.00 1.57 *** 1.40 *** 2.52 *** 19,450 8,873 27,758 1,137 1.00 2.83 *** 1.97 *** 3.30 *** Home 6,066 1,009 5,996 1.00 1.05 0.80 *** 13,378 12,771 31,069 1.00 2.00 *** 1.28 *** N/R home Hospital
Variations according to area characteristics Density: <65: little variation >65 reduced linkage in more rural areas Deprivation: Reduced linkage in most deprived areas Imputation: Strong gradient (esp. at younger ages) and reduced linkage where census worst
Variation by cause of death All ages Under 65 years old Deaths (%unmatched) Deaths (%unmatched) 70,289 (6.9%) 13,970 (5.6%) 7,211 (6.8%) 9,722 (7.0%) 18,572 (5.6%) 2,634 (15.2%) 1,719 (12.3%) 702 (19.9%) 12,840 (8.9%) 13,071 (11.1%) 2,064 (9.4%) 542 (8.9%) 802 (9.9%) 4,846 (8.1%) 1,648 (20.3%) 830 (18.2%) 649 (21.4%) 2,579 (13.6%) All causes I.H.D Stroke Respiratory Disease Cancer All External causes Accidents Suicides Other Causes
2. Some people are ghosts even before they are dead! Problem: Some people were not there in the first place Imputation and the one-number census Why is this a problem? How is this handled in the different LS-s Solutions: ?sensitivity analyses Last night upon the kitchen stair, I met a man who wasn t there, He wasn t there again today, I wish, I wish he d go away... (Hughes Mearns)
3. Sometimes there arent enough deaths (death is not what it used to be ) Events, dear boy, events Harold Macmillan
General Problem ... falling death rates Crude death rate in Northern Ireland 1971 2014 in people aged less than 75 years 9.0 8.0 7.0 6.0 Male 5.0 4.0 Female 3.0 2.0 1.0 0.0
3. Sometimes there arent enough deaths: other small number problems Population sub-groups Eg U/E; ethnic minorities; others? Cause-specific mortality; Suicides, trauma, specific cancers etc
3. Sometimes there arent enough deaths: Potential solutions Increase the length of follow-up; Aggregate sub-populations; Increase the cohort size
4. Death is more or less certain; cause of death less so. Uncertainties in cause of death; Coding difficulties ICD9-10 changes. Why are these problems?
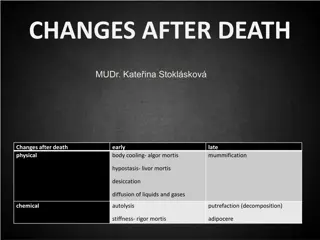
Some problems with mortality data Diagnosis may be wrong Coding may be wrong Interpretation difficult Incidence confounded by investigation Mortality confounded by treatment
Percentage of deaths by age group males and females: Northern Ireland selected years Females Males 100% 90% 80% 85 and over 70% 65-84 45-64 60% 45-44 50% 1-14 Under 1 40% 30% 20% 10% 0% 1923 1943 1963 1983 2003 1923 1943 1963 1983 2003
Cause of death in Northern Ireland in 1922 100 90 Other 80 Old age Percentage of all deaths External 70 Cancer 60 Respirator y Circulatio n 50 40 30 20 10 0 15-19 35-39 55-59 75-79 10-14 20-24 25-29 30-34 40-44 45-49 50-54 60-64 65-69 70-74 80-84 85-89 90-94 0-4 5-9 95+
Cause of death in Northern Ireland 2002 100% Other 80% Old age External 60% Cancer 40% Respiratory Circulation 20% Infection 0% 0-4 5-9 10- 15- 19 20- 24 25- 29 30- 34 35- 39 40- 44 45- 49 50- 54 55- 59 60- 64 65- 69 70- 74 75- 79 80- 84 85+ 14
5. Migration (further problems with the un-dead)
Possible LS Linkages & Analyses a b c Census 1 Census 2
5. Migration Two things in life that are notcertain, death and taxes ask a non-dom Problem 1: (the un-dying) Selective unrecorded emigration; who does this affect? Death rate = (Number of deaths) / (population at risk) Solution: ?? Better sources of migration
5. Migration Problem 2: (the un-dead) Non inclusion of migration data; is this a problem and if so what is the effect? Death rate = (Number of deaths) / (population at risk) Solution: ??
6. Yes, but you wouldnt want to start from here.
6. Yes, but you wouldnt want to start from here. Problem: All census-based longitudinal studies start with a cross-sectional study. Risk of death U/E ??
Possible LS Linkages & Analyses Start point a b c Census 1 Census 2
6. Yes, but you wouldnt want to start from here. U/E Risk of death Poor health Health selection effects Others eg Marital status; Carers; the retired
6. Yes, but you wouldnt want to start from here. Possible solutions: Adjust using LLTI/GH Drop early deaths Time dependent variable Other statistical techniques
7. The non-longitudinal aspects of longitudinal data Problem: We assume that most characteristics do not change between censuses. Is this valid? What is the effect on results? Solutions: Are there any alternative ways to update the data? I ain't what I used to be, but who the hell is? Dizzy Dean
8. Theres never a good time to start thinking about death Study 1: What is the mortality risk of carers? deaths Carer status 2021 Census 2011 Census
Study 2: What are the social factors related to mortality risk for alcohol-related causes of death? deaths 1991 Census 2001 Census 2011 Census 2021 Census
9. It all depends how well adjusted you are Problem: Adjust for S.E.S. Effectiveness, fairness; residual confounding Urban/rural differences Difficulties at older ages Should you adjust for economic activity? Adjust for Health How is this done? Solutions: ???
10. Death is not the only answer; there are always other options. Good for some research questions Overall mortality risk Premature mortality Avoidable mortality etc Not so good for others Confounded by variations in detection and treatment Eg breast and testicular cancer Alcohol-related mortality gross underestimation of burden and associations (RTA, suicides etc)
Thank you for your patience Any questions? It's not that I'm afraid to die, I just don't want to be there when it happens. I don't want to achieve immortality through my work. I want to achieve it through not dying. Woody Allen