Insights on Disability Voter Turnout in the 2020 Elections
Discover key findings on the voter turnout among people with disabilities in the 2020 elections compared to previous years, analyzing data and trends. Understand the impact and potential gaps in disability turnout rates.
Download Presentation

Please find below an Image/Link to download the presentation.
The content on the website is provided AS IS for your information and personal use only. It may not be sold, licensed, or shared on other websites without obtaining consent from the author. If you encounter any issues during the download, it is possible that the publisher has removed the file from their server.
You are allowed to download the files provided on this website for personal or commercial use, subject to the condition that they are used lawfully. All files are the property of their respective owners.
The content on the website is provided AS IS for your information and personal use only. It may not be sold, licensed, or shared on other websites without obtaining consent from the author.
E N D
Presentation Transcript
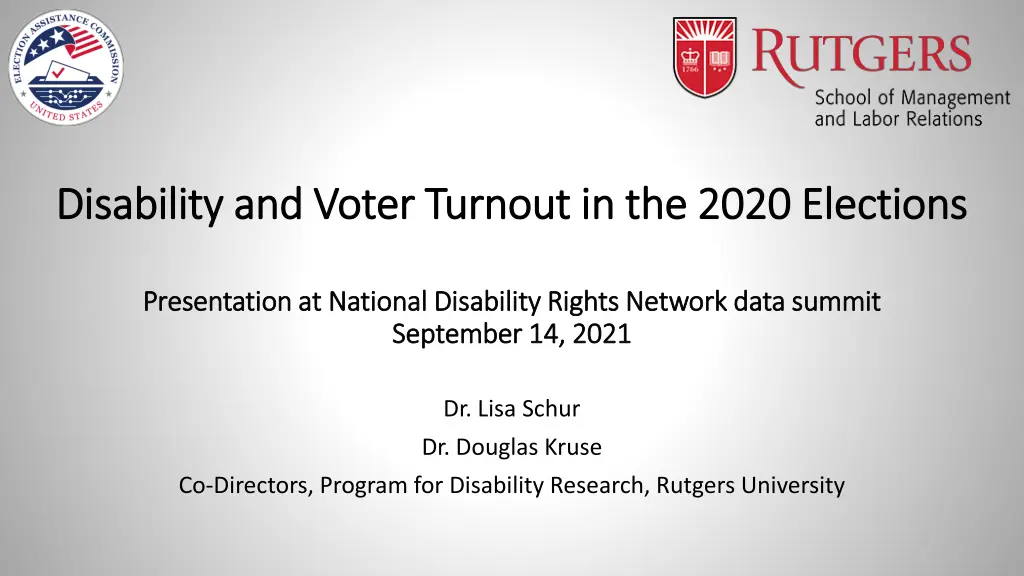
Disability and Voter Turnout in the 2020 Elections Disability and Voter Turnout in the 2020 Elections Presentation at National Disability Rights Network data summit Presentation at National Disability Rights Network data summit September 14, 2021 September 14, 2021 Dr. Lisa Schur Dr. Douglas Kruse Co-Directors, Program for Disability Research, Rutgers University
How likely were people with disabilities to vote in 2020? Among those who voted, how many used mail ballots or the option of voting early? How did 2020 disability turnout compare to past elections? To answer these and other questions, we analyzed data from the November 2020 Voting and Registration Supplement in the Census Bureau s Current Population Survey. It contains responses from 81,898 voting-eligible citizens, including 11,000 citizens with disabilities. We compare these data to 2016 when there was a sample of 93,794, including 12,791 with disabilities.
Definition of Disability Disability is defined in the Census surveys by a yes response to one or more of six questions identifying: 1. Hearing impairment 2. Visual impairment 3. Mental or cognitive impairment 4. Difficulty walking or climbing stairs 5. Difficulty inside the home (dressing or bathing) 6. Difficulty going outside the home doing errands alone
Key result: Voter turnout surged in 2020 among people with disabilities an increase of 5.9 percentage points from 2016 compared to an increase of 5.3 points for people without disabilities. 17.7 million people with disabilities voted in 2020, representing 11.4% of all voters 80.0% 67.5% 62.2% 61.8% 55.9% 60.0% 40.0% 20.0% 0.0% Disability No disability 2016 2020
The surge in turnout occurred across the major types of disability 2016 2020 Change Hearing impairment Visual impairment Mental or cognitive impairment Difficulty walking or climbing stairs 55.8% Difficulty dressing or bathing Difficulty going outside alone 62.7% 53.7% 43.5% 68.5% 59.2% 50.7% 60.4% 49.4% 51.6% 5.8% 5.5% 7.2% 4.6% 4.9% 6.9% 44.5% 44.7%
People with disabilities did, however, remain less likely than people without disabilities to vote, although the disability turnout gap may have narrowed slightly. 2016 62.2% 55.9% 2020 67.5% 61.8% People without disabilities People with disabilities Disability turnout gap -6.3% -5.7% The disability turnout gap was large enough to be outside the margin of error in both years, although the change in the gap from 2016 to 2020 was within the margin of error, so we cannot be highly confident that the gap is closing.
Why is there a disability turnout gap? It s not explained by lower interest in politics and elections among people with disabilities, as shown by polls. Past research shows that the gap is partly explained by: Lower resources (income and education) Greater social isolation (more likely to live alone, less likely to be employed) Lower belief that political system is responsive Voting difficulties (see next slide)
Importance of accessible voting We worked with the EAC on a 2020 post-election national survey with 2,569 respondents (findings released February 16, 2021). Results on voter turnout and method were very similar between this survey and the Census data. In addition, the EAC survey found: One in nine (11%) of voters with disabilities in 2020 encountered difficulties in voting, which was almost twice the rate of voters without disabilities (6%). Combined with the Census turnout data, we estimate that 1.95 million people with disabilities encountered difficulties voting in 2020. This is a significant improvement from a similar 2012 survey, when one-fourth (26%) of voters with disabilities reported problems, compared to 7% of voters without disabilities. At least half of the improvement was due to greater accessibility of polling places since 2012, while the other half resulted from the shift to increased voting by mail during the pandemic.
Method of voting People with disabilities are historically more likely than those without disabilities to vote by mail. The 2020 Census data show: Only one-fourth (26%) of voters with disabilities voted at a polling place on election day, compared to 31% of voters without disabilities. Voters with disabilities were also less likely to vote early at a polling place or election office (21% compared to 27%) They were more likely to vote by mail (53% compared to 42%) The increase in voting by mail between 2016 and 2020 was similar between voters with disabilities (increase of 24 percentage points) and those without disabilities (22 points) Voting by mail is not easy for everyone: in the EAC/Rutgers survey, 22% of people with visual impairments reported difficulty voting with a mail ballot
Breakdown by demographic factors The surge in turnout among people with disabilities occurred across major demographic categories: Women and men Blacks, Hispanic/Latinx, White non-Hispanic/Latinx, and Other Age groups: 18-34, 35-49, 50-64, 65+ Region: Northeast, Midwest, South, West As in past elections, there was no turnout gap between employed people with and without disabilities => Employment appears to play a very positive role in political inclusion as well as economic inclusion of people with disabilities
Voter registration Eligible citizens with disabilities in 2020 were 3 points less likely to be registered to vote than those without disabilities (70% compared to 73%) Among those who were registered, people with disabilities were 4 points less likely to vote (88% compared to 92%) => So overall disability turnout gap is due both to lower registration, and lower turnout among those registered to vote Registered people with disabilities were more likely than those without disabilities to register at a town hall or election office, and less likely to register at a department of motor vehicles Asked why they did not register, non-registered people with disabilities were more likely to give permanent illness or disability as a reason, and less likely than those without disabilities to say they were not interested in the election or did not meet registration deadlines.
Reasons for not voting Among those who were registered but did not vote: Just over one-third (37%) of people with disabilities said they did not vote because of illness or disability (own or family s) They were less likely than non-voters without disabilities to say they were not interested (13% compared to 19%), did not like the candidates or campaign issues (11% to 16%), or were too busy (4% to 16%) The percent saying they did not vote due to concerns about the coronavirus pandemic was similar between people with and without disabilities (5% compared to 4%)
Changes in state rules on mail ballot access The increase in voter turnout appears to be larger in states that made it easier to vote by mail, although the differences were not strong enough to be outside the margin of error. Increase in turnout from 2016 to 2020 Disability No change in mail ballot access (27 states) 4.9% Easier to request mail ballot in 2020 than in 2016 (16 states) 7.0% All voters sent ballots in 2020, but not in 2016 (7 states + DC) 6.7% No disability 5.0% 4.0% 8.4%
Key Takeaways (1 of 3) Voter turnout surged in 2020 among people with disabilities Despite the barriers they often face, people with disabilities are just as interested in elections as people without disabilities, and turn out to vote when motivated A turnout gap remained, however, between people with and without disabilities in 2020 Combined with results on voting difficulties from the EAC/Rutgers post-election survey, an estimated 1.95 million voters with disabilities encountered some type of difficulty voting in the 2020 general elections.
Key Takeaways (2 of 3) People with disabilities are more likely than those without disabilities to use a mail ballot, while the increase in mail ballots during the pandemic was similar between voters with and without disabilities But mail ballots are not a panacea. The large variation in types and severity of disabilities means that one size fits all does not work for many people, and having more options in how to vote will help the turnout of people with disabilities Past research indicates that inaccessible voting systems can discourage turnout, not only by making it more difficult to vote, but also through psychological effects by sending the message that people with disabilities are not welcome in the political sphere.
Key Takeaways (3 of 3) The improved accessibility since 2012 is likely to have helped turnout among people with disabilities in 2020, which reflects well on the efforts of disability advocates and organizations, the EAC, election officials, and policy-makers. There is a need for continued progress in improving accessibility, and ensuring people with disabilities can easily exercise their right to vote. We welcome any questions we want to make these results as useful as possible for increasing access to voting among people with disabilities.


