Insights on Global Growth and Sustainability
Data on global ecological footprint, population projections, air quality, carbon dioxide emissions, greenhouse gas emissions, and their impact on our environment and economy in the twenty-first century. Gain valuable insights from figures depicting environmental trends and scenarios for a sustainable future.
Download Presentation

Please find below an Image/Link to download the presentation.
The content on the website is provided AS IS for your information and personal use only. It may not be sold, licensed, or shared on other websites without obtaining consent from the author.If you encounter any issues during the download, it is possible that the publisher has removed the file from their server.
You are allowed to download the files provided on this website for personal or commercial use, subject to the condition that they are used lawfully. All files are the property of their respective owners.
The content on the website is provided AS IS for your information and personal use only. It may not be sold, licensed, or shared on other websites without obtaining consent from the author.
E N D
Presentation Transcript
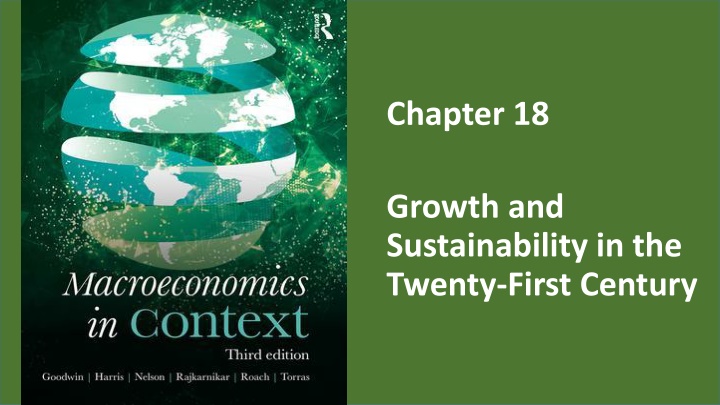
Chapter 18 Growth and Sustainability in the Twenty-First Century
Figure 18.1 Global Ecological Footprint, by Impact Type, 1965-2013 Source: Global Footprint Network Public Data Set, https://www.footprintnetwork.org/resources/data/.
Figure 18.2 United Nations Global Population Projections, 2020-2100 Source: United Nations, World Population Prospects 2017.
Figure 18.3 Average Particulate Matter Concentration, Selected Major Cities Source: World Health Organization, Ambient Air Quality Database. Notes: Particulate matter concentrations in g/m3; data vary by city, between 2012 and 2015.
Figure 18.4 Global Carbon Dioxide Emissions, 1965-2016, OECD and Non-OECD Countries Source: BP, 2017.
Figure 18.5 Global Greenhouse Gas Emissions Under Alternative Scenarios Source: Climate Action Tracker, http://climateactiontracker.org/global.html. Note: Emissions data include carbon dioxide and other greenhouse gases converted to carbon dioxide equivalents.
Figure 18.6 Environmental Kuznets Curve for Particulate Matter Source: Mazurek, 2011.
Figure 18.7 Relationship between Carbon Dioxide Emissions and GDP per Capita, 2014 Source: World Bank, World Development Indicators database.
Figure 18.8 Jobs Generated by Investing One Million Dollars in Clean Energy versus Fossil Fuel Production, Select Countries Source: Pollin, 2015.
Figure 18.9 A No-Growth Scenario for the Canadian Economy Source: Adapted from Victor, 2008, p. 182.
Figure 18.10 Environmental Taxes, as a Percent of Total Tax Revenues, Select Countries, 2015 Source: OECD, OECD.Stat, Environmentally related tax revenue.
