Insights on Global Organic Agriculture 2014
Explore data on organic agriculture worldwide in 2014, including the development of countries with data, the top countries with organic agricultural land, distribution by region, highest shares by country, growth trends from 1999 to 2014, and more. Gain valuable insights into the organic farming landscape.
Download Presentation

Please find below an Image/Link to download the presentation.
The content on the website is provided AS IS for your information and personal use only. It may not be sold, licensed, or shared on other websites without obtaining consent from the author. If you encounter any issues during the download, it is possible that the publisher has removed the file from their server.
You are allowed to download the files provided on this website for personal or commercial use, subject to the condition that they are used lawfully. All files are the property of their respective owners.
The content on the website is provided AS IS for your information and personal use only. It may not be sold, licensed, or shared on other websites without obtaining consent from the author.
E N D
Presentation Transcript
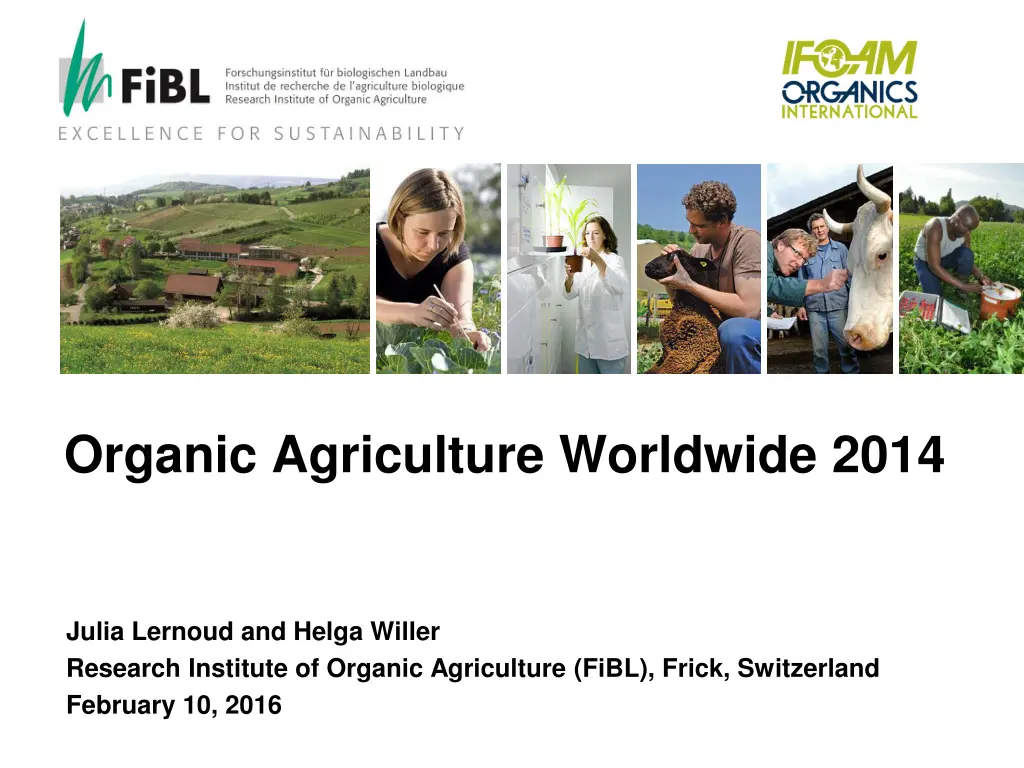
Organic Agriculture Worldwide 2014 Julia Lernoud and Helga Willer Research Institute of Organic Agriculture (FiBL), Frick, Switzerland February 10, 2016
Development of the number of countries with data on organic agriculture Development of the number of countries with data on organic agriculture Source: FiBL-IFOAM-SOEL-Surveys 1999-2016 200 170 172 180 162 161 160 140 164 161 155 140 122 135 120 110 Countries 121 97 100 77 100 80 86 60 40 20 0 1999 2000 2001 2002 2003 2004 2005 2006 2007 2008 2009 2010 2011 2012 2013 2014 www.fibl.org
The ten countries with the largest organic agricultural land 2012 The ten countries with the largest areas of organic agricultural land 2014 Source: FiBL survey 2016 Australia (2013) 17.2 Argentina 3.1 US (2011) 2.2 China 1.9 Spain 1.7 Italy 1.4 Uruguay 1.3 France 1.1 Germany 1.0 Canada 0.9 0 5 10 15 20 Million hectares www.fibl.org
Distribution of organic agricultural land by region 2012 Distribution of organic agricultural land by region 2014 Source: FiBL Survey 2016 Africa 3% North America 7% Asia 8% Oceania 40% Latin America 15% Europe 27% www.fibl.org
The ten countries with the highest shares of organic agricultural land 2012 Countries with more than 10 percent of organic agricultural land 2014 Source: FiBL survey 2016 Falkland Islands (Malvinas) 36.3% Liechtenstein 30.9% Austria 19.4% Sweden 16.4% Estonia 16.2% Samoa 14.3% Switzerland 12.7% Sao Tome and Principe 12.0% Latvia 11.2% Czech Republic 11.1% Italy 10.8% 0% 5% 10% 15% 20% 25% 30% 35% 40% Share of total agricultural land www.fibl.org
Growth of the organic agricultural land 1999-2012 Growth of the organic agricultural land 1999-2014 Source: FiBL-IFOAM-SOEL-Surveys 1999-2016 50 43.243.7 45 34.436.335.737.5 37.6 40 35 29.929.230.131.5 Million hectares 30 25.7 25 19.8 20 17.3 14.9 15 11.0 10 5 0 1999200020012002200320042005200620072008200920102011201220132014 www.fibl.org
Growth of the organic agricultural land by continent 1999-2012 Growth of the organic agricultural land by continent 1999-2014 Source: FiBL-IFOAM-SOEL-Surveys 1999-2016 20 18 16 14 Million hectares 12 10 8 6 4 2 0 1999200020012002200320042005200620072008200920102011201220132014 Africa Asia Europe Latin America Northern America Oceania www.fibl.org
Growth of the organic agricultural land by continent 2005-2013 Growth of the organic agricultural land by continent 2006-2014 Source: FiBL-IFOAM survey 2008-2016 17.34 20.0 18.0 16.0 12.43 12.16 12.15 12.11 11.63 11.14 14.0 Million hectares 10.01 12.0 8.27 10.0 7.54 7.27 7.24 6.95 6.79 8.0 4.95 6.0 3.57 3.36 3.22 3.08 3.01 3.00 2.58 2.47 2.46 1.79 4.0 1.26 1.15 1.08 0.89 0.68 2.0 0.0 Africa Asia Europe Latin America 2012 Northern America 2014 Oceania 2006 2008 2010 www.fibl.org
Growth of the organic land by land use type 2004-2013 Development of the organic land by land use type 2004-2014 Source: FiBL-IFOAM-SOEL-Surveys 1999-2016 30 27.027.5 25 22.322.9 23.122.6 22.6 21.8 20.120.420.0 Arable crops 20 Million hectares Permanent crops 15 Permanent grassland 8.5 10 8.0 7.6 7.4 6.2 5.5 4.9 4.6 4.3 4.1 5 3.4 3.4 3.3 3.2 2.9 2.6 2.5 2.0 1.9 1.4 1.4 0.9 0 2004 2005 2006 2007 2008 2009 2010 2011 2012 2013 2014 www.fibl.org
The ten countries with the largest numbers of organic producers 2012 The ten countries with the largest numbers of organic producers 2014 Source: FiBL survey 2016 India (2013) 650,000 Uganda 190,552 Mexico (2013) 169,703 Philippines 165,974 Tanzania (2013) 148,610 Ethiopia (2013) 135,827 Turkey 71,472 Peru 65,126 Paraguay 58,258 Italy 48,662 0 200,000 400,000 600,000 800,000 Number of producers www.fibl.org
Organic producers by region 2012 Organic producers by region 2014 Source: FiBL Survey 2016 Oceania 1% North America 1% Europe 15% Asia 40% Latin America 17% Africa 26% www.fibl.org
The ten countries with the largest markets for organic food 2012 The ten countries with the largest markets for organic food 2014 Source: FiBL-AMI survey 2016 United States of America 27,062 Germany 7,910 France 4,830 China 3,701 Canada 2,523 United Kingdom 2,307 Italy 2,145 Switzerland 1,817 Sweden 1,402 Austria 1,065 0 5,000 10,000 Retail sales in million Euros 15,000 20,000 25,000 30,000 www.fibl.org
The ten countries with the largest per capita consumption for 2012 The ten countries with the highest per capita consumption 2014 Source: FiBL-AMI survey 2016 Switzerland 221 Luxembourg 164 Denmark 162 Sweden 145 Liechtenstein 130 Austria 127 Germany 97 United States 85 Canada 77 France 73 0 50 100 150 200 250 Per capita consumption in euros www.fibl.org
Global market: Distribution of total retail sales value by country Global market: Distribution of retail sales value by country 2014 Source: FiBL-AMI survey 2016, based on retail sales with organic food Other 16% Switzerland 3% Italy 3% USA 43% UK 4% Canada 4% China 6% France 8% Germany 13% www.fibl.org
Global market: Distribution of total retail sales value by single markets (total: 47.8 billion) Euros 2013 World: distribution of retail sales by single market 2014 Source: FiBL-AMI survey 2016 Switzerland 3% Other Canada 4% China 6% USA 43% EU-28 38% www.fibl.org
Acknowledgements The Swiss State Secretariat of Economic Affairs SECO, Berne International Trade Centre ITC N rnberg Messe, the organizers of the BioFach World Organic Trade Fair 200 experts from all parts of the world contributed to the FiBL-IFOAM survey 2014. www.fibl.org
The World of Organic Agriculture 2016 The 17th edition of The World of Organic Agriculture , was published by FiBL and IFOAM Organics International in February 2016.* Contents: Results of the survey on organic agriculture worldwide; Organic agriculture in the regions and country reports; Australia, Canada, the Pacific Islands, and The United States of America. Chapters on the global market, standards & legislations, voluntary standards , PGS, European market, data collection in Thailand and Australia Numerous tables and graphs. New addittions: Better Data: highlights examples of how organic market data are collected and associated challenges Commomdity case studies: a section for the analysis of selected commodities The book can be ordered via IFOAM.bio and shop.FiBL.org. *Willer, H, Lernoud, J, (eds.) (2016) The World of Organic Agriculture. Statistics and Emerging Trends 2016. FiBL, Frick, and, IFOAM Organics International, Bonn http://www.organic- world.net/yearbook/yearbook-2016.html www.fibl.org
Contact Helga Willer and Julia Lernoud Research Institute of Organic Agriculture (FiBL) Ackerstrasse 113, 5070 Frick, Switzerland Tel. +41 79 218 0626, Fax +41 62 865 7273 helga.willer@fibl.org und julia.lernoud@fibl.org www.fibl.org, www.organic-world.net Willer, Helga and Julia Lernoud (Eds.) (2016): The World The World of Organic Agriculture. Statistics and Emerging Trends 2016. FiBL, Frick and IFOAM Organics International, Bonn http://www.organic-world.net/yearbook/yearbook- 2016.html www.fibl.org


