Insights on Interim Provost's Report & Enrollment Trends 2015-2020
Discover the details from the Interim Provost's Report to the Faculty Senate on online teaching certification requirements and enrollment trends from 2015 to 2020, showcasing changes in undergraduate, masters, and doctoral majors.
Download Presentation

Please find below an Image/Link to download the presentation.
The content on the website is provided AS IS for your information and personal use only. It may not be sold, licensed, or shared on other websites without obtaining consent from the author. If you encounter any issues during the download, it is possible that the publisher has removed the file from their server.
You are allowed to download the files provided on this website for personal or commercial use, subject to the condition that they are used lawfully. All files are the property of their respective owners.
The content on the website is provided AS IS for your information and personal use only. It may not be sold, licensed, or shared on other websites without obtaining consent from the author.
E N D
Presentation Transcript
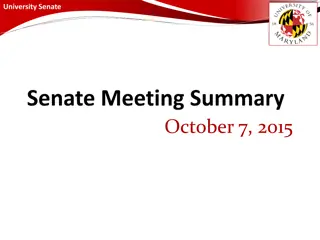
Interim Provosts Report to Faculty Senate October 22, 2020
Online Teaching Certification > UM System eLearning Academic Council and the Online Faculty Advisory Committee developed a list of certification options to fulfill the existing, UM System-wide requirement that instructors teaching online courses be certified to do so prior to teaching online. > Required for individuals teaching online courses, including semester-based and self-paced, synchronous and asynchronous courses. > S&T faculty can satisfy the requirement by completing any of the following by September 20, 2021: ~20hrs of effort over a 6-wk Online Teaching Certification Seminar by September 20, 2021, OR Start Here 101: Online Course Design Basics and Start Here 102: Best Practices in Online Instruction , OR A graduate degree or certification in online learning, educational & instructional technology, or learning systems & design, OR Certification through a national organization such as the Association of College and University Educators (ACUE), Quality Matters (QM), or Online Leaching Consortium (OLC), OR Similar online training at another university, plus the UM System recertification program, OR Have at least 5 years of online teaching experience, plus the UM System recertification program.
Enrollment Trends 2015-2020 TOTAL UG TOTAL MS TOTAL PhD Majors headcount 2017-2020 Undergraduate Majors headcount 2017-2020 Masters Majors headcount 2017-2020 Doctoral 7000 1500 700 -11.1% since 2015 -12.1% since 2017 No change since 2015 -15.4% since 2018 680 1400 -34.5% since 2015 6800 660 1300 # of Students 6600 TOTAL PhD TOTAL UG 640 TOTAL MS 1200 620 6400 1100 600 6200 1000 580 6000 900 560 2015 2016 2017 2018 2019 2020 2015 2016 2017 2018 2019 2020 2015 2016 2017 2018 2019 2020 Year (4th week census) YEAR YEAR YEAR
Enrollment Trends Numbers of students enrolled in undergraduate major (numbers include students who have a 2nd major) Abs 43 94 82 136 47 39 29 5 % 18.5 22 14 14 10 7 4 3 Program 2017 Aero Eng 232 Applied Math Env Eng Inf Sci & Tech History BA/BS Multidisc St Tech Comm Philosophy 2020 275 72 68 122 37 32 25 2 30.6 20.6 11.5 27.0 21.9 16 150 Growth (+8% or more) Chem BA/BS Civil Eng Elec Eng Arch Eng 125 Bus & Mgt Sys Eng Mgt 83 359 349 118 118 208 84 356 343 -7 109 194 1 -3 -6 -5.6 -9 -14 1.2 -0.8 -1.7 Stable (-7.9 to +7.9%) -7.6 -6.7
Enrollment Trends Numbers of students enrolled in undergraduate major (numbers include students who have a 2nd major) Abs 14 66 50 80 60 87 232 226 299 39 58 41 49 -64 738 36 % -7 -8 -12 -19 -21 -22 -27 -30 -32 -33 -34 -39 -43 -9.4 -95 -104 Program 2017 English Psych BA/BS Metal Eng Physics Geol Eng Cer Eng Comp Eng Biol BA/BS Chem Eng Econ BA/BS Nuclear Eng Geo & Geophy Mining Eng Comp Sci 684 Mech Eng Petrol Eng 2020 21 74 62 99 81 109 259 256 331 72 92 80 92 620 833 140 -33.3 -10.8 -19.4 -19.2 -25.9 -20.2 -10.4 -11.7 -9.7 -45.8 -40.0 -48.8 -46.7 All combined, these majors have lost 15.6% of their enrollment since 2017. Loss (-8% or more) -11.4 -74.3
Enrollment Trends Numbers of students enrolled in Master s programs Abs 61 13 18 50 14 4 7 7 % 14 46.4 11 5 5 19.0 2 1 Program 2017 Systems Eng I/O Psych 28 Tech Comm MBA Nuclear Eng Aero Eng 21 Mining Eng Metal Eng 2020 47 41 7 45 9 25 5 6 29.8 157.1 11.1 55.5 Growth (+8% or more) 40.0 16.7 Explos Eng Biology Applied Math Cer Eng Geotech 30 10 10 1 22 31 10 10 1 22 1 0 0 0 0 3.3 0 0 0 0 Stable (-7.9 to +7.9%)
Enrollment Trends Numbers of students enrolled in Master s programs Abs 1 16 4 1 39 45 14 -15 15 43 7 9 53 41 13 106 % -1 -2 -2 -4 -7 -12 -15 -32.6 -17 -17 -22 -22 -35 -40 -42 -62 Program 2017 Chemistry Manufact Eng Mat Sci Eng Physics Inf Sci & Tech Civil Eng Comp Eng Comp Sci 46 Geo & Geophy Mech Eng Chem Eng Env Eng Geol Eng Elec Eng Petrol Eng Eng Mgt 2020 2 18 6 5 46 57 29 31 32 60 29 27 88 81 55 168 -50.0 -11.1 -33.3 -80 -15.2 -21.1 -51.7 All combined, these programs have lost 41.5% of their enrollment since 2017. Loss (-8% or more) -53.1 -28.3 -75.9 -66.7 -37.8 -49.4 -76.4 -36.9
Enrollment Trends Numbers of students enrolled in Doctoral programs Abs 35 62 14 11 % 10 9 3 3 Program 2017 Mat Sci Eng Civil Eng Cer Eng Metal Eng 2020 25 53 11 8 40.0 17.0 27.3 37.5 Growth (+8% or more) Math Physics Chemistry Elec Eng 29 30 45 63 28 28 43 68 -1 -2 -2 -5 -3.4 -6.7 -4.4 -7.9 Stable (-7.9 to +7.9%)
Enrollment Trends Numbers of students enrolled in Doctoral programs Abs 15 31 11 12 14 21 16 37 -14 20 20 -23 55 % -2 -3 -5 -5 -7 -7 -9 -12 -35.9 -14 -14 -46.0 -38 Program 2017 Comp Eng Geo & Geophy Explos Eng Systems Eng Eng Mgt Geol Eng Mining Eng Chem Eng Aero Eng 39 Nuclear Eng Petrol Eng Comp Sci 50 Mech Eng 2020 17 34 16 17 21 28 25 49 25 34 34 27 93 -11.8 -8.8 -31.2 -29.4 -33.3 -25.0 -36.0 -24.5 All combined, these programs have lost 33.5% of their enrollment since 2017. Loss (-8% or more) -41.2 -41.2 -40.9
Update on Recruiting Year-to-date status of applications and admissions Abs % COHORT 2020 2021 Freshmen Applications Admitted 1272 2005 1301 1869 29 -136 2.3 -6.8 Transfer Fall Apps 43 Fall Admits 53 5 10 36 23.3 31 620 Spring Apps Spring Admits 131 21 140 77 9 56 6.9 267 Master s Fall Apps 40 Fall Admits 42 9 2 18 5 9 100 Spring Apps Spring Admits 226 109 469 364 243 255 108 234
Questions? Woodkern














![Overview of the Faculty Senate at [Institution Name]](/thumb/233771/overview-of-the-faculty-senate-at-institution-name.jpg)