Explore key findings on physician-patient communication performance worldwide, as revealed by the Worldwide Independent Network (WIN) of Market Research. This research examines the impact of communication on medical education, treatment decisions, and patient compliance, providing valuable insights for healthcare stakeholders.
Please find below an Image/Link to download the presentation.
The content on the website is provided AS IS for your information and personal use only. It may not be sold, licensed, or shared on other websites without obtaining consent from the author. If you encounter any issues during the download, it is possible that the publisher has removed the file from their server.
You are allowed to download the files provided on this website for personal or commercial use, subject to the condition that they are used lawfully. All files are the property of their respective owners.
The content on the website is provided AS IS for your information and personal use only. It may not be sold, licensed, or shared on other websites without obtaining consent from the author.
E N D
Presentation Transcript
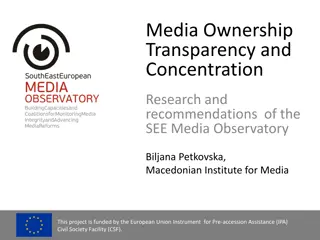
Doctor - Patient Global Communication Performance Insights from the Worldwide Independent Network (WIN ) of Market Research Fall, 2011 1
Contents 1. Background & Research 3 2. Context and Methodology 4 3. Key Findings 6 4. Communication Assessment Tool 7 5. Medication Usage 10 2
1. Background & Research Background WIN , the Worldwide Independent Network of Market Research, the largest independent organization of Market Research firms with members in 64 countries, prepared this landmark review of physician-patient communication. Research Physician-Patient communication critically influences the effectiveness of medical education initiatives, treatment decisions and patient compliance to recommended treatments. WIN communication throughout the world to provide the healthcare stakeholders with a better understanding on how patients perceive communication skills of their doctor, how patients engage their physician, how treatment choices are influenced, the frequency and preferred modes of interaction and sources of influentialinformation. conducted this ground-breaking study on physician-Patient 3
2. Context and Methodology Methodology and Geographical distribution: In total, the study was carried out in 39 countries. In each country, the most appropriate interviewing methodology was used given local conditions. Fieldwork dates: Fieldwork was conducted between July 19th2011 and October 3rd2011. Sample: The total size of the sample is 31 577 cases representative of 1 938 990 516 people. Sample in each country is probabilistic and was designed to represent the general adult population. General coverage of the sample is as follows: 75% national 25% urban Weighting: The data was weighted in two steps to obtain representation by country and worldwide. The data was first weighted to generate data representative of the general population for each country. A second weight, according to the size of the population surveyed, was then applied to obtain global and regional totals. The margin of error per country is between +/- 2.34% and 5.66%, 19 times out of 20. The table on the next page presents a summary of the methodology used in each country to conduct this survey. Each sample is representative of its country s population in terms of socio-demographic variables. Sample sizes ensure accurate generalizations to the total population and allow a very precise interpretation of the results. 4
2. Context and Methodology Sample representation Population represented by sample Fieldwork datesMargin of Country Firm Method Sample Total Population Sampling Method Age Weighting variables error +/- MPG LLC (Marketing Professional Group) Colmar Brunton Armenia CATI 1003 7 953 438 Quota Sampling National 3 356 000 18+ Gender, Age Aug. 12-25 3.09% Australia Online 910 20 000 000 Stratified National 18 200 000 18+ Gender, Age, Region Gender, Age, Region,Employment, Income No Gender Age, Employment Gender, Age, Region, Type of settlement Gender, Age, Region, language Gender, Age, Location Aug. 4-10 3.25% Austria Gallup Austria Face to Face 532 8 400 000 Random quota sampling National 7 300 000 14+ Jun. 20 - Aug. 3 4.25% Bosnia Brazil Mareco Index Bosnia Ibope Inteligencia CATI 750 3 850 000 190 000 000 Multistage random sample Probabilistic National National 2 950 000 141 248 576 15+ 16+ Jul. 19 - Aug. 5 Aug. 11-15 3.58% 2.61% Face to Face 1410 Bulgaria BBSS Face to Face 633 7 300 000 Random National 6 500 000 18+ Jul. 28-Aug,04 3.90% Canada Leger Marketing Online 1004 33 739 900 Random National 24 750 000 18+ Aug. 8-15 3.09% Chile IBOPE Inteligencia Chile CATI 473 15 116 435 Random Urban 5 408 150 18-60 Aug. 19- Sep. 5 4.51% Random Sampling with online Panel (Shanghai, Beijing and Guangzhou) China WisdomAsia Online 400 1 300 000 000 Urban 51 520 000 15+ No Aug. 11-17 4.90% Colombia CNC (Centro Nacional de Consultoria) CATI 612 44 000 000 Two-stage design applied simple random sampling Urban 13 826 630 18-65 No Aug. 23-29 3.96% Czech Republic Denmark Finland 18+Gender, Age, Region, Size of Community 18+ 15+ Gender, Age, Region Gender, Age, Region, Occupation 18-70 Gender, Age, Region 18-74 Region 15+ Gender, Age 16+ Gender, Age, Region 18+ Gender, Age, Social class and Regio. 18+Gender, Age, Region, Size of Community, Occupation 18-79 18+ 18+ 15-74 Gender, Age, Education Gender, Age, Region size, Nationality Gender, Age, Region, Type of settlement 18+ Mareco Ltd. Face to Face 1000 10 224 626 Random route sampling National 8 392 530 Aug. 4-15 3.10% DMA Research Taloustutkimus Oy Online Online 510 522 5 600 000 5 385 000 Random Random National Nationl 4 200 000 4 577 250 No Aug. 12-15 Aug. 12-19 4.34% 4.29% France BVA Online 999 65 000 000 Quota Method National 50 700 000 18+ Aug. 1-4 3.10% Germany Greece Hong Kong Iceland India Produkt+Markt Centrum S.A Consumer Search Capacent DataPrompt Online CATI CATI Online CATI 1006 300 800 717 803 81 800 000 10,961,758 7 100 000 320 000 1 210 193 422 Random Statified National Urban National National Urban 56 500 000 6,351,506 6 130 300 247 437 963 600 000 Jul. 25-Aug. 2 Jul. 18-Aug. 3 Jul. 30-Aug. 19 Aug. 10-18 Jul. 23-Aug. 19 3.09% 5.66% 3.46% 3.66% 3.46% Random quota sampling Random from our Web-panel Random Random digital dial including both landline and mobile numbers No Ireland Red C Research CATI 839 4 580 000 National 3 203 814 18+ Aug. 8-10 3.38% Italy Doxa CATI 882 60 300 000 Random National 50 000 000 Jul. 21-24 3.30% Japan Kenya Lebanon Luthuania NRC (Nippon Research Center ) Infinite Insight Reach UAB RAIT Online Face to Face 1003 CATI Face to Face 1000 126,475,664 38 610 097 3 759 136 3 200 000 Random Random Random National National National National 99,604,610 26 254 865 2 781 760 2 625 400 No No No Aug. 11-15 Jul. 30-Aug. 8 Aug. 1-30 Aug. 1-18 3.10% 3.09% 4.38% 3.10% 1000 703 Random Probilty Routine Macedonia BRIMA Face to Face 820 2 052 722 Multi stage stratified random probability National 1 689 265 15+ Sept. 1-7 3.42% Pakistan Gallup Pakistan Face to Face 1752 187 342 721 Stratified Probability Sampling National 88 000 000 18+ Aug. 7-13 3.70% Palestine PCPO Face to Face 992 4 170 000 Random National 1 876 500 No Jul. 20-Aug. 15 2.34% Peru Datum Face to Face 918 27 412 157 probabilistic, multistage stratified allocation Urban 16 085 385 18-69 Gender, Region Aug. 5-8 3.11% Poland Romania Russia Saudi Arabia Mareco TNS CSOP Romir PARC Face to Face Face to Face Online CATI 305 750 1180 1155 38 200 000 21 431 298 143 000 000 27 000 000 Stratified random Stratified Probability Sampling Random Random Random (Johannesburg, Durban, Capetown ) Random Soft Quota Statified Random-quota Stratified (governorates are strata) Random Urban National Urban Urban 5 100 000 18 190 003 69 000 000 13 000 000 15-65 18+ 18-44 15+ No Jul. 28-Aug. 2 Jul. 24-Aug. 1 Aug. 5-9 Jul. 19 - Aug. 24 3.23% 5.61% 3.58% 2.85% Gender, Age, Region Gender, Age, Region No South Africa TRS (Topline Research Solutions) Face to Face 400 49 320 000 Urban 33 819 800 18+ Gender, Age, Region Jul. 29-Aug. 10 2.88% Korea Sweden Swizterland Tunisia USA Gallup Korea CMA Research Isopublic EMRHOD TRiG Online Online Face to Face CATI Online 500 1049 343 600 1002 49 773 145 9 446 812 7 870 134 9 910 872 313 232 044 National National National National National 40 359 211 7 250 000 6 050 314 732 326 234 265 000 18+ 15-75 15-74 18+ 18+ Gender, Age No Gender, Age, Region No Gender, Age, Region, Race Aug. 9-18 Aug. 9-13 Sept. 21-Oct. 3 Aug. 22-27 Aug. 8-12 4.90% 3.03% 5.29% 4.00% 3.10% 5
3. KEY FINDINGS Doctor-Patient Relationship Around the World 1. Communication effectiveness between doctors and patients is related to being compliant to taking prescribed medication exactly as the doctor directed. 2. Communication Assessment Tool (CAT ) showed the communication between doctor and patients is poor with a very low score of 22%. 3. Asian markets are amongst the lowest on communication effectiveness. 4. Directionally, comparing results from prior years, communication effectiveness between doctors and patients on a global level trended downward. 6
5. Doctor Communication Assessment Tool Q. Thinking of your most recent visit, please rate the doctor s communication with you. CAT (Comunnication Assessment Tool) Attributes 2011 % 2010 % Talked in terms I could understand How would you rate the care provided by your doctor Compared to last year, fewer citizens rated their doctor as excellent this year in all of the 15 communication assessment categories asked in the survey. 25 32 24 30 Paid attention to me (looked at me, listened carefully) 24 32 Only a quarter or less rate their doctor as excellent in all of the categories. 24 Treated me with respect 34 Greeted me in a way that made me feel comfortable 23 29 23 Only 18% of respondents felt their doctor encouraged them to ask question. Showed care and concern 30 Understood my main health concerns 23 30 Discussed next steps, including any follow-up plans 22 29 With only 25%, talk in terms I could understand this is the attribute that received the rating of excellent most frequently. Gave me as much information as I wanted 22 30 22 Let me talk without interruptions 31 Showed interest in my ideas about my health 22 29 Key Finding: Spent the right amount of time with me 22 30 Checked to be sure I understood everything A quarter or less of citizens rate their doctor as excellent in all of the categories. 21 27 Involved me in decisions as much as I wanted 19 25 18 Encouraged me to ask questions 23 22 Total 29 *Global totals represent the averages of the top boxes scores in every surveyed country **In 2010, 23 countries participated in the survey. IN 2011, 39 countries participated in the survey of which only 15 were recurrences from 2010. 7 7
5. CAT (Communication Assessment Tool) Q. Thinking of your most recent visit, please rate the doctor s communication with you. Communication Assessment Tool (CAT) Communication Assessment Tool (CAT) 2011 % 66 66 59 56 51 49 48 48 45 43 37 36 35 33 32 28 27 25 24 - 23 23 23 - 22 22 21 21 21 20 20 19 16 - 15 14 13 11 11 10 - 6 5 22 2010 % NA NA NA NA NA NA 52 40 51 47 NA NA 39 NA NA NA 30 NA 25 30 NA 22 NA 15 40 NA 11 NA NA NA 17 NA NA NA NA 4 11 NA 7 29 Overall, the CAT score in the 39 surveyed countries is at a low of 22. Country Ireland Armenia Chile Macedonia Bosnia Australia USA Lebanon Saudi Arabia Canada Sweden Germany France Switzerland Greece Colombia Iceland South Africa Bulgaria Brazil Lithuania Russia Tunisia Korea Austria Denmark Italy Czech Rep. Romania Finland India Kenya Palestine Hong Kong Poland China Japan Peru Pakistan Total The Communication Assessment Tool (CAT), developed by Makoul et al, assesses patient physicians interpersonal communication skills. perceptions of The country with the highest CAT score is Ireland with a score of 66. On the other hand, Pakistan continues to record a low CAT score with the lowest this year at 5 (Pakistan scored a 7 in 2010). and The CAT is a 15-item survey that is easily administered in a format, via the phone or Internet. The CAT asks respondents to rate different dimensions of the communication and interpersonal skills of the physician using a 5-point rating scale (1=poor, 2=fair, 3=good, 5=excellent). Makoul et al found that scoring the CAT proportion of items rated as excellent was more meaningful than summarizing the scores using psychometric analysis scales indicated that a rating excellent was akin to yes , while even very good was closer to no than yes. Data for the present study were analyzed using the sum of the items scored as excellent divided by the number of items answered.* paper-and-pencil Of the countries that participated in the survey for the past two years, Austria s CAT score most decreased (-19) while Italy (+10), Lebanon (+8), Korea (+7), China (+7) most increased. 4=very good, based on the means. of Their response of Key Finding: On average, citizens throughout the world give their doctor a low CAT score. *Source: http://www.stfm.org/fmhub/fm2010/September/ Linda567.pdf (2010) 8 8 **In 2010, 23 countries participated in the survey. IN 2011, 39 countries participated in the survey of which only 15 were recurrences from 2010.
5. Global Communication Assessment Tool (CAT) Summary Summer 2010 Doctor-Patient Relationship around the world High CAT scores Citizens in Armenia, Australia, Bosnia, Canada, Chile, Columbia, France, Germany, Greece, Ireland, Lebanon, Macedonia, Switzerland, and the USA are very satisfied with their communication with their doctors with CAT scores above average. Saudi Arabia, Sweden, Key Finding: Low CAT scores Middle East 42 Citizens in China, Hong Kong, India Japan, Kenya, Pakistan, Palestine, Peru, Poland and are the least satisfies with their doctor with below average CAT scores. Americas 38 Western Europe 31 Eastern Europe 23 Average CAT scores Africa 21 Respondents in Austria, Brazil, Bulgaria, Czech republic, Denmark, Finland, Iceland, Italy, Korea, Lithuania, Romania, Russia, South Africa and Tunisia have average CAT scores. Asia 16 Total 22 9 *The data for this graph is based on questions presented on slides 12. For the definitions of CAT (communication Assessment Tool) please refer to slide 12.
6. Medication Usage Q. Do you currently have a medication that was prescribed by the doctor with whom you most recently met? Q. How often would you say you have taken this prescription medication exactly according to the doctor s direction? Most of the time % 55 54 21 30 28 23 32 25 7 23 6 15 18 18 32 18 26 42 20 19 13 10 19 43 14 27 23 34 18 47 16 20 24 7 21 42 18 34 19 31 Only some of the time/Rarely % 3 10 8 3 38 5 1 17 9 3 3 14 7 3 3 6 29 3 3 2 9 4 8 14 8 23 8 6 38 11 10 20 3 25 13 7 29 22 20 12 Yes % All the time % 39% of individuals currently have a medication that was prescribed by a doctor. 80 68 63 62 58 57 57 55 53 53 52 52 50 50 50 49 48 48 48 47 47 47 46 44 43 41 40 39 39 38 38 37 37 35 35 32 31 26 24 39 43 36 70 67 34 72 68 58 84 73 91 70 75 79 64 75 44 55 76 77 78 85 72 41 78 50 68 61 43 41 74 58 73 68 65 50 53 44 60 57 China Korea USA Australia Palestine Canada Austria South Africa Bosnia France Bulgaria Colombia Romania Denmark Germany Sweden Czech Rep. Japan Italy Poland Ireland Macedonia Lithuania Hong Kong Brazil Tunisia Switzerland Iceland Armenia Pakistan Lebanon Saudi Arabia Finland Greece Chile Russia Peru India Kenya Total Just over half (57%) of respondents take the medication exactly according to the doctor s directions and another 31% take the medication according to the doctor s direction most of the time. While Bulgarians are most likely to take prescription medication exactly according to direction (91%), citizens of Peru and Czech Republic are the least likely to do so with 29% who answered that they only some of the time or rarely take the medication according to direction. Of those on prescribed medicaton, taken medication according to doctor's direction Key Finding: Just over half (57%) of citizens on prescribed medication take it exactly according to the doctor s directions. 10 10


")
 Summary Summer")