Discover the evolving landscape of education in South Africa with a focus on the importance of math and science skills for the 21st century. Explore opportunities and challenges in secondary education, practical subjects, and ICT skills, along with strategies for maximizing human capital development. Gain valuable insights from international tests like TIMSS Grade 9 mathematics to gauge performance and drive continuous improvement.
Please find below an Image/Link to download the presentation.
The content on the website is provided AS IS for your information and personal use only. It may not be sold, licensed, or shared on other websites without obtaining consent from the author. If you encounter any issues during the download, it is possible that the publisher has removed the file from their server.
You are allowed to download the files provided on this website for personal or commercial use, subject to the condition that they are used lawfully. All files are the property of their respective owners.
The content on the website is provided AS IS for your information and personal use only. It may not be sold, licensed, or shared on other websites without obtaining consent from the author.
E N D
Presentation Transcript
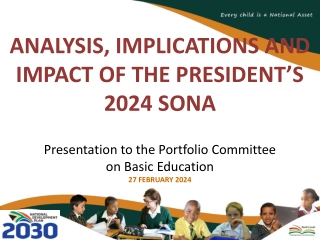
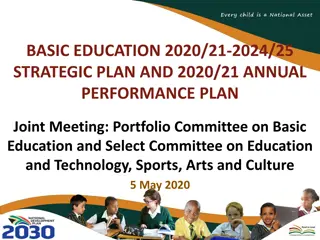
Basic Education Lekgotla 2024 Recent South African trends and what they mean for the future Martin Gustafsson March 2024
Skills for the 21st century are not only about mathematics and science, but this is inevitably an important part. From the African Union s Continental Education Strategy for Africa(CESA): The relevance of secondary education remains a concern as it relates to employability, technical and vocational training and articulation with tertiary education. Math and science at this level are critical to the development of a well-equipped human capital capable of competing in increasingly science and technology-driven world as well as the foundation for knowledge-based economies.
TWENTY-FIRST CENTURY OPPORTUNITIES 1. Let us not fall for the worst in the world narrative, which is not supported by data, and realise that internationally we have co-travellers. 2. Schools now roughly meet minimumuniversity demand for sufficient mathematics and science skills, but we should go beyond this minimum, for various reasons the pipeline suggests this can be done in the near future. 3. Let us go on focussing on mathematics outcomes our participation levels are on the whole not the problem. 4. Let us maximise the employment impacts of our expanding set of practical subjects. 5. As we continue to grow ICT skills, let us draw from what we already have, and consider existing (often unexpected) pockets of mathematics excellence.
TWENTY-FIRST CENTURY PLANNING This has become possible thanks to the efforts of thousands of people inside and outside government, building systems based on the latest technologies, but also paying attention to detail as we routinely gather and quality-assure our data.
1. Our performance in the international tests TIMSS Grade 9 mathematics 6 6 6 6 % of learners with this IRT score (rounded to the % of learners with this IRT score (rounded to the % of learners with this IRT score (rounded to the % of learners with this IRT score (rounded to the Average score: Average score: 2002: 285 2002: 285 2011: 353 Average score: Average score: 2002: 285 2002: 285 2011: 353 2011: 353 2015: 372 2015: 372 2019: 389 5 5 5 5 2002: 11% 2002: 11% 2011: 24% 2002: 11% 2002: 11% 2011: 24% 2011: 24% 2015: 34% 2015: 34% 2019: 41% closest multiple of 10) closest multiple of 10) closest multiple of 10) closest multiple of 10) 4 4 4 4 3 3 3 3 2 2 2 2 1 1 1 1 0 0 0 0 0 0 0 0 100 100 100 100 200 200 200 200 300 300 300 300 400 400 400 400 500 500 500 500 Low international benchmark 600 600 600 600 700 700 700 700 IRT score IRT score IRT score IRT score 2002 2002 2002 2002 2011 2011 2011 2011 2015 2015 2015 2015 2019 2019 2019 2019
1. Our performance in the international tests Grade 9 versus Grade 8, but in both cases second grade of secondary 6 6 6 % of learners with this IRT score (rounded to the % of learners with this IRT score (rounded to the % of learners with this IRT score (rounded to the Average score: Average score: ZAF Gr 9 Average score: ZAF Gr 9 ZAF Gr 9 2011: 353 2011: 353 2019: 389 MAR Gr 8 2011: 371 2019: 388 5 5 5 closest multiple of 10) closest multiple of 10) closest multiple of 10) 4 4 4 MAR Gr 8 MAR Gr 8 2011: 371 3 3 3 2 2 2 1 1 1 0 0 0 0 0 0 100 100 100 200 200 200 300 300 300 400 400 400 500 500 500 600 600 600 700 700 700 IRT score IRT score IRT score 2011 ZAF 2011 ZAF 2011 ZAF 2019 ZAF 2019 ZAF 2019 ZAF 2011 MAR 2011 MAR 2011 MAR 2019 MAR 2019 MAR 2019 MAR
Note that the pipeline for South Africa (and Morocco) is relatively favourable. The co-travellers . With historical levels of improvement we can reach where Malaysia was in 2019 in 2035. 1. Our performance in the international tests 6 6 % of learners with this IRT score (rounded to the % of learners with this IRT score (rounded to the % over 400 in 2019: ZAF 41% MAR 41% EGY 55% CHL 70% IRN 68% % over 400 in 2019: ZAF 41% MAR 41% EGY 55% CHL 70% IRN 68% MYS 74% MYS 74% 88% ?? 85% 98% 86% 88% 5 5 closest multiple of 10) closest multiple of 10) 4 4 3 3 2 2 % successfully completing lower secondary Lastly, there is no credible evidence supporting the notion that South Africa s pandemic-related learning losses were exceptionally large. 1 1 0 0 0 0 100 100 200 200 300 300 400 400 500 500 600 600 700 700 IRT score IRT score ZAF ZAF MAR MAR EGY EGY CHL CHL IRN IRN MYS MYS
2. Mathematics and science supply and demand School supply The number of year-end Grade 12 NSCs meeting university entrance Bachelors or Diploma requirements increased from 260,000 in 2011 to 470,000 in 2023. University demand First-year university admissions have been at most 180,000 in recent years. Sufficient mathematics, and to some extent physical sciences, marks are a more formidable barrier for the school-to-university transition. Around two-thirds of first-year university students are subject to some mathematics admissions criteria.
2. Mathematics and science supply and demand These supply-demand questions should be more closely monitored, but with the 2023 rise in high-level mathematics achievers in NSC, we are roughly meeting the demand. 120,000 Youths with at least this combination of marks 100,000 2019 University requirements 80,000 School supply 2018 9% under- supply Small over- supply 60,000 40,000 20,000 0 40-0 50-0 50-50 60-0 60-40 60-50 60-60 Combination of mathematics and physical science threshold marks It is not enough just to reach the minimum demand, for various reasons.
3. Mathematics participation and outcomes % who get 60 or more in mathematics Participation in mathematics has been declining: from 48% to 38% between 2011 and 2023. On both axes, % of all full-time NSC candidates How big a problem is this? 7.0 6.5 % of all full-time NSC candidates 6.0 obtaining 60% in mathematics 5.5 5.0 4.5 4.0 3.5 3.0 2.5 2.0 25 30 35 40 45 50 55 60 % of all full-time NSC candidates taking mathematics % who take mathematics
3. Mathematics participation and outcomes For the other 7 provinces, more 60 achievers tends to come with lower participation. 7.0 WC 6.5 % of all full-time NSC candidates 6.0 obtaining 60% in mathematics R = 0.849 (7 provinces) 5.5 GP 5.0 FS 4.5 MP 4.0 3.5 NW KZ EC NC LP 3.0 2.5 Two provinces clearly struggle on both 2.0 25 30 35 40 45 50 55 60 % of all full-time NSC candidates taking mathematics indicators The context is tough examinations, of a world standard, but also high failure rates. 2019
3. Mathematics participation and outcomes Maximum was 7.0, now down to 3.5 3.5 3.3 GP MP FS LP % of all full-time NSC candidates 3.1 obtaining 60% in mathematics WC (7 provinces) 2.9 2.7 KZ 2.5 NW 2.3 EC 2.1 Looking only at data for black African and coloured. 1.9 NC 1.7 1.5 25 30 35 40 45 50 55 60 % of all full-time NSC candidates taking mathematics
3. Mathematics participation and outcomes The journey of KwaZulu-Natal 2015 to 2023 is telling. 7.0 6.5 % of all full-time NSC candidates 6.0 obtaining 60% in mathematics 2023 5.5 5.0 4.5 Participation declined from 52% to 41%, while % of all candidates becoming mathematics 60 achievers increased from 3.5% to 5.5%. 4.0 2015 3.5 2019 3.0 2.5 2.0 25 30 35 40 45 50 55 % of all full-time NSC candidates taking mathematics
4. Greater participation in practical subjects Except for Math lit and Math , these are the official organising fields . Inevitably, some of the discussion around 21st century readiness must focus on grades 10 to 12 subject offerings and uptake. 100 Services PAT (3) 90 Culture PAT (5) 80 % of all non-language in Grade 12 Manuf PAT (4) 70 Agric PAT (2) 60 Physical PAT (4) 50 Agric (1) 40 Business (4) 30 Physical (non-math) (5) Math lit (1) 20 Math (1) 10 Human (3) 0 2011 2015 2019 2022
18 practical subjects (subjects with PATs) increased from 8% to 11% 2011 to 2022. Largely driven by Tourism. 4. Greater participation in practical subjects 100 Services PAT (3) 90 Culture PAT (5) 80 % of all non-language in Grade 12 Manuf PAT (4) 70 Agric PAT (2) 60 Physical PAT (4) 50 Agric (1) 40 Business (4) 30 Physical (non-math) (5) Math lit (1) 20 Math (1) 10 Human (3) 0 2011 2015 2019 2022
4. Greater participation in practical subjects Humanities participation has grown 14% to 22%. Largely History. 100 Services PAT (3) 90 Culture PAT (5) 80 % of all non-language in Grade 12 Manuf PAT (4) 70 Agric PAT (2) 60 Physical PAT (4) 50 Agric (1) 40 Business (4) 30 Physical (non-math) (5) Math lit (1) 20 Math (1) 10 Human (3) 0 2011 2015 2019 2022
4. Greater participation in practical subjects 3 large business- oriented subjects have shrunk. 100 Services PAT (3) 90 Culture PAT (5) 80 % of all non-language in Grade 12 Manuf PAT (4) 70 Agric PAT (2) 60 Physical PAT (4) 50 Agric (1) 40 Business (4) 30 Physical (non-math) (5) Math lit (1) 20 Math (1) 10 Human (3) 0 2011 2015 2019 2022
4. Greater participation in practical subjects Small subjects that should be larger to deal with complex demands of 21st century? 100 Services PAT (3) 90 Culture PAT (5) 80 % of all non-language in Grade 12 Manuf PAT (4) 70 Agric PAT (2) 60 Physical PAT (4) 50 Agric (1) 40 Business (4) 30 Physical (non-math) (5) Math lit (1) 20 Math (1) 10 Human (3) 0 2011 2015 2019 2022
5. ICT skills and pockets of mathematics excellence Not % of Grade 12s in one year, but of a whole birth cohort data now allows for the individual tracking of learners over years Not surprising. Mathematics excellence largely concentrated in urban. But some rural areas, National average: 4.0% especially in LP and MP, performing fairly well. Top 5 Tshwane South: 11.3% Metro Central: 9.9% Cape Winelands: 7.0% Johannesburg North: 6.5% Umlazi: 6.4% Gauteng
All 4 Johannesburg districts: 3.4% 5. ICT skills and pockets of mathematics excellence Capricorn (incl. Polokwane): 5.2% Vhembe: 4.8% Why does this When happen? concentrating just on black African and coloured learners, urban areas often lag behind. National average: 3.1% What are the implications for strategy? Motheo (incl. Bloemfontein): 2.8% Thabo Mofutsanyana (TH): 3.8% All 4 Cape Town districts: 2.9% OR Tambo inland (incl. Mthatha): 4.1% females have caught up with males on this indicator. Important observation on gender: in recent years
5. ICT skills and pockets of mathematics excellence Turning to the 2 Grade 12 computer subjects Here the new ten districts in LP illustrated. east-west contrast is reversed. In NC, could be about dealing with remoteness. It s as if the
Three roughly equal groups of Gr 12 learners 5. ICT skills and pockets of mathematics excellence - School participates in NSC computer subject - No NSC computer participation, but has computer lab - No NSC computer participation, no computer lab Sub-sample of the 2022 School Monitoring Survey Grade 12 sample A low-hanging fruit ? And it s not just about the hardware.