Insights on US Financial Conditions, Market Volatility, and Equity Valuations
"Explore the impact of unconventional monetary policy on interest rates, asset prices, and US financial conditions. Analyze the October sell-off, lower valuations, equity price trends, and market volatility, providing a comprehensive overview of the current economic landscape." (242 characters)
Download Presentation

Please find below an Image/Link to download the presentation.
The content on the website is provided AS IS for your information and personal use only. It may not be sold, licensed, or shared on other websites without obtaining consent from the author. If you encounter any issues during the download, it is possible that the publisher has removed the file from their server.
You are allowed to download the files provided on this website for personal or commercial use, subject to the condition that they are used lawfully. All files are the property of their respective owners.
The content on the website is provided AS IS for your information and personal use only. It may not be sold, licensed, or shared on other websites without obtaining consent from the author.
E N D
Presentation Transcript
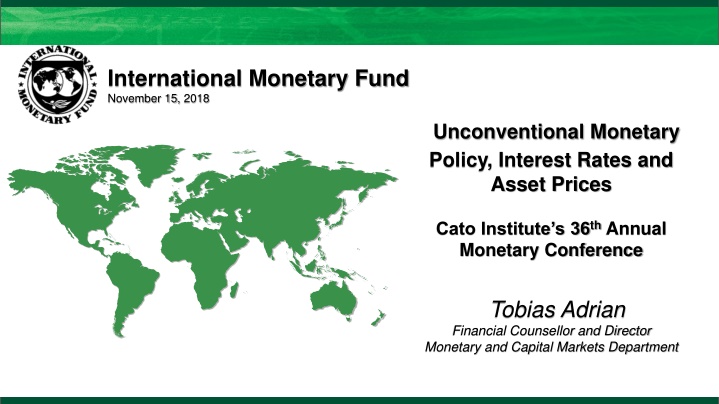
International Monetary Fund November 15, 2018 Unconventional Monetary Policy, Interest Rates and Asset Prices Cato Institute s 36th Annual Monetary Conference Tobias Adrian Financial Counsellor and Director Monetary and Capital Markets Department
US Financial Conditions Are Unusually Easy Last GFSR has been offset by an easing in the US, despite policy rate hikes, Financial conditions in the US eased, despite policy rate hikes which is in contrast with other areas Financial Conditions and US Federal Funds Rate Financial Conditions Indices of Other Advanced and Emerging Market Economies (z-scores over 2010-18) 2.0 Tighter conditions US Financial Conditions Index and Federal Funds Rate (z-scores over 2010-18 and percent) 2.5 1.0 0.0 1993-94 1999-00 2004-06 2015-present Tighter conditions Financial Conditions Index -0.1 1.5 0.5 April GFSR 2.0 -0.2 Last GFSR 1.0 -0.3 0.0 0.5 Tighter conditions 1.5 -0.4 0.0 -0.5 -0.5 1.0 -0.6 -0.5 -1.0 -0.7 -1.0 0.5 -0.8 -1.5 -1.5 -0.9 Rate hikes -2.0 0.0 -2.0 -1.0 2015 AE ex. US 2016 2017 2018 2015 Federal Funds Rate (lhs) 2016 2017 2018 0 1 Fed funds rate (percent) 2 3 4 5 6 7 China EM ex. China FCI (rhs) 1
The October Sell-Off Led to Lower Valuations A sharp selloff in US stocks in October triggered a global stock market correction leading to a significant fall in equity valuations Major Stock Index Performance (index to Jan 1, 2018; YTD change in parentheses) 12-month Forward Price-to-Earnings Ratio (z-score since 1987; current value in parentheses) 110 1.0 105 0.5 100 0.0 95 -0.5 90 -1.0 US (5.1%) Europe (-7.7%) US (15.3) Europe (11.9) 85 -1.5 Japan (-7.5%) EM (-13.8%) Japan (12.3) EM (10.2) 80 -2.0 Jan Feb Mar Apr May Jun Jul Aug Sep Oct Nov 2012 2013 2014 2015 2016 2017 2018 2
US Equity Valuations Are Still Somewhat Stretched but remained somewhat elevated Relative valuations have also come down... US Equity Prices versus Model-based Fair Values (as of Oct-29) US Equity Prices versus Model-based Fair Values (as of Oct-29) 3300 Actual Weighted average fitted value 3100 Range of model estimates 2900 2700 2500 2300 2100 1900 1700 1500 2015 2016 2017 2018 3
Market Volatility is Still Relatively Low but remain compressed relative to model estimates Residual Risk Premia for US Corporate Bonds (Difference between the corporate spread and the default risk component; percent) US Equity Volatility: Market Implied versus Model-Based Forecast (Over different terms; percent) 16 Model based Market implied 18 14 17 US high yield 12 16 US investment grade 10 15 8 14 13 6 12 4 11 2 10 0 9 -2 8 2006 07 08 09 10 11 112 13 14 15 16 17 18 0 6 12 18 24 Months 4
Commodity Prices May Add to Volatility Oil prices have recently dropped adding to concerns about a slowdown in the global output Brent Spot and Futures Prices Commodities and Manufacturing 550 55 90 80 54 500 70 53 450 60 52 400 50 51 350 40 50 30 300 49 20 250 48 2015 2016 2017 Brent (5-yr forward, rhs) 2018 2015 2016 Commodities (lhs) 2017 2018 Brent spot (lhs) Global PMI (rhs) 5
Loan issuance reached record highs in 2017 Highly leveraged loan deals have grown as a share of new corporate issuance in the U.S. and Europe CLO formation and loan fund growth remains robust U.S. and European Leveraged Loan Issuance by Debt-to-Earnings Multiple (Percent of issuance) US CLO Issuance and Bank Loan Fund Assets Under Management (Billions of US dollars) New-Issue Global Leveraged Loan Volume (Billions of US dollars) 80 140 220 900 CLO issuance (left scale) United States 5.00x 5.99x US Issuers Non-US Issuers 200 800 United States 6.0x or Higher 70 120 180 Bank loan mutual fund and ETF AUM (right scale) Europe, multiple of 5.00 to 5.99 700 60 160 100 Europe, multiple of 6 or more 600 50 140 500 80 120 40 400 100 60 30 300 80 40 20 60 200 40 100 10 20 20 0 0 0 0 05 06 07 08 09 10 11 12 13 14 15 16 17 18 02 04 06 08 10 12 14 16 18 6


