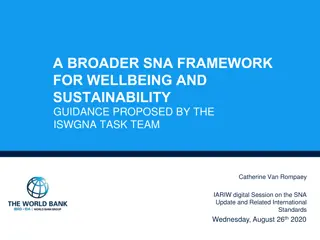
Institutional Interrelations in Distributive Transactions
This proposal by Susana Santos explores improving national accounts data for input-output analysis by focusing on institutional interrelations in distributive transactions. The study delves into the construction of matrices for distributive transactions, extending input-output analysis to income distribution. The historical context, including the System of National Accounts, adds depth to the examination of income distribution within the framework of national economic data. Through a magnifying glass, Santos provides insights into utilizing national accounting data effectively for economic analysis and policy development.

Download Presentation

Please find below an Image/Link to download the presentation.
The content on the website is provided AS IS for your information and personal use only. It may not be sold, licensed, or shared on other websites without obtaining consent from the author.If you encounter any issues during the download, it is possible that the publisher has removed the file from their server.
You are allowed to download the files provided on this website for personal or commercial use, subject to the condition that they are used lawfully. All files are the property of their respective owners.
The content on the website is provided AS IS for your information and personal use only. It may not be sold, licensed, or shared on other websites without obtaining consent from the author.
E N D
Presentation Transcript
30thInternational Input-Output Association Conference 1st- 5thJuly 2024, Santiago, Chile Institutional interrelations in distributive transactions seen through a magnifying glass. A proposal to improve national accounts data for use in input-output analysis. Susana Santos UECE (Research Unit on Complexity and Economics) - REM (Research in Economics and Mathematics) ISEG - Lisbon School of Economics and Management, Universidade de Lisboa
Institutional interrelations in distributive transactions seen through a magnifying glass. A proposal to improve national accounts data for use in input-output analysis. Santos, S. Outline 1. Introduction 2. Carrying out input-output analysis in the study of income distribution with data from national accounts 3. Institutional sectors and distributive transactions in national accounts 4. Construction of from-whom-to-whom matrices for distributive transactions 5.A possible use of from-whom-to-whom matrices for distributive transactions to extend input-output analysis to income distribution 6. Concluding remarks 2
Institutional interrelations in distributive transactions seen through a magnifying glass. A proposal to improve national accounts data for use in input-output analysis. Santos, S. 1. Introduction The first step to integrate input-output analysis in national accounts was taken in A System of National Accounts , released in 1968, under the chairmanship of Richard Stone. .. first paragraph to Chapter III (the system as a basis for input-output analysis) of Stone s authorship The input-output data contained in the system appear in the rows and columns relating to commodities and industries. In order to explain and illustrate how these data can be used for input- output analysis, a magnifying glass has been applied to the relevant parts of table 2.1 (UN, 1968, p. 35; table 2.1 is an illustration of the complete system, in a matrix form, that is, in a social accounting matrix). from a formal point of view, input-output analysis could be carried out with other parts of the national accounts ... Graham Pyatt and his associates presented an analysis ... in which they wanted to emphasise the distribution of income to set up a framework within which they could analyse actual and potential policies (Stone, 1981, pp. 62-63) 3
Institutional interrelations in distributive transactions seen through a magnifying glass. A proposal to improve national accounts data for use in input-output analysis. Santos, S. 1. Introduction System of National Accounts (SNA) 2008, current version, covers industry interrelations in transactions related to products with the supply and use tables, from which input-output accounts can be conceived institutional interrelations in financial transactions with the flow-of-funds tables or matrices institutional interrelations in distributive transactions .. LEFT OUT 2025 SNA !? .. based on the work of Richard Stone, Graham Pyatt and some of their followers, namely Jeffery Round the measurement of is addressed a proposal to improve national accounts data for use in input-output analysis is made applied to the national accounts of a fictious country, in a specific year, at current prices, in currency units - the numerical example used in the 2008 SNA 4
Institutional interrelations in distributive transactions seen through a magnifying glass. A proposal to improve national accounts data for use in input-output analysis. Santos, S. 2. Carrying out input-output analysis in the study of income distribution with data from national accounts (data and system) [Stone (1986)] Diagram of the functioning of the national accounts facts, organised (sources and methods) as far as possible into a set of accounts quantitative framework theories, or hypotheses, about the technical and behavioural relationships that connect the accounts model, - constructed by combining facts and theories - when translated into quantitative terms will give us an idea how the system under investigation actually works aims, to change the system - introduced in the descriptive model sketching out a policy controls, specify the way in which we propose to realise the policy, thus, enabling.. to draw up a plan ... can run through the computer to show .. the probable repercussions of .. changes throughout the system .. it is likely that when the plan is actually put into practice, events will reveal its deficiencies experience reconsider As experience feeds back we shall get a better model, a better policy, a better plan 5
Institutional interrelations in distributive transactions seen through a magnifying glass. A proposal to improve national accounts data for use in input-output analysis. Santos, S. 2. Carrying out input-output analysis in the study of income distribution with data from national accounts A Social Accounting Matrix (square matrix representation of the complete system of national accounts) has two versions: a numerical version - describes empirically the activity of a country and the corresponding incomings and outgoings - each cell has a specific numerical value, with the sums of the rows being equal to the sums of the columns an algebraic version - describes theoretically that same activity - each cell is filled with algebraic expressions that, together with those of all the other cells, form a SAM-based model, the calibration of which involves a replication of the numerical version SAM-based approach 6
Institutional interrelations in distributive transactions seen through a magnifying glass. A proposal to improve national accounts data for use in input-output analysis. Santos, S. 2. Carrying out input-output analysis in the study of income distribution with data from national accounts Expenditures / Uses Endogenous Exogenous Total Sum n Sum x /Resources Endogenous N = An. n Total X yn = n + x yn = An.yn + x (An = N. n-1) Receipts l R r yx = l + r yx = Al.yn + r L = Al. n (Al = L. n-1) with the accounting multipliers (Ma), the impact of changes in receipts is analysed at the moment, assuming that the structure of expenditure in the economy does not change Exogenous y n y x yn= n + x = An.yn+ x = (I-An)-1.x = Ma.x l = Al.yn= Al.(I-An)-1.x = Al.Ma.x changes associated to distribution and redistribution of income depending on the available data, more or less powerful magnifying glasses can be applied to the parts identified as the focus of interest, allowing more or less detail in the quantification of the effects of the studied changes x 7
Institutional interrelations in distributive transactions seen through a magnifying glass. A proposal to improve national accounts data for use in input-output analysis. Santos, S. 3. Institutional sectors and distributive transactions in national accounts Institutional sectors - mutually exclusive groups of institutional units entities with legal responsibility for their actions and various economic functions in the country recorded in current (*) and capital (**)(flow) accounts distributive transactions in which the income generated in the production process is distributed among labour, capital and taxes on production and imports involving redistribution of the income and wealth [(*) distribution of income accounts] [(*) redistribution (and use) of income accounts; (**) capital (accumulation) account] involves economic activities that, under the control and responsibility of institutional sectors, use inputs of labour, capital, and goods and services to produce outputs of goods and services added value = output of goods and services - intermediate consumption = generated income remuneration of factors of production beginning of the distribution process (and of the recording of distributive transactions) 8
Institutional sectors contribution to the production of goods and services totals will remain until the end of the distribution process the big difference production process, .. income is generated Factor income originating Redistribution: receipts and payments of factor income Factor income retained Income from employment (D1) Other income (B2&3g,D4) Income from employment (D1) Income from employment (D1) Other income (D4) Other income (B2&3g,D4) Total Total Resources less usesNet gain or loss (-)Resources less usesNet gain 6 7 -986 96 -44 149 -98 22 1143 123 -11 7 or loss (-) 9 1 2 3 4 5 8 10 11 12 S11 Non-financial corporations S12 Financial corporations S13 General government S14 Households S15 NPISHs 986 44 98 11 11 292 46 27 145 1278 0 0 0 -986 -44 -98 -11 -11 -134 -168 -42 -41 -38 -19 -20 82 0 0 0 254 27 254 27 90 125 156 14 7 7 1154 1154 227 1381 3 0 -6 1 0 4 4 residual difference (D21-D31) S1 All domestic sectors (total economy) 1150 513 1663 1154 -1150 4 397 -391 6 1154 519 1673 S2 Rest of the world 6 44 50 2 -6 -4 38 -44 -6 2 38 40 Total 1156 557 1713 1156 -1156 0 435 -435 0 1156 557 1713 Factor income retained, with net taxes on production and imports (B5g; B12 part) Factor income originating, with net taxes on production and imports(B1g, GDP; B12 part) net taxes on production and imports (D2-D3) Net gain or loss (-) Resources less uses 12+a 3-b 254 27 198 1381 a b c 1331 94 126 155 15 S11 Non-financial corporations S12 Financial corporations S13 General government S14 Households S15 NPISHs -53 -4 -1 -53 -4 190 191 1 1 4 -1 -1 -133 -191 -133 residual difference (D21-D31) S1 All domestic sectors (total economy) [Gross Domestic Product] [Gross National Income] [current external balance (part)] 133 1 864 191 0 1 854 S2 Rest of the world 0 0 0 40 50 Total 191 -191 0 1 904 9 1 904
first round third round second round fourth round Chain of redistribution Redistribution: adjustment..in pension entitlements, capital transfers (D8, D9) Net lending (+) / net borrowing ( ) (B9) Redistribution: social benefits.., other current transfers (D62,D7) Redistribution: taxes on income, ..social contributions (D5, D61) Disposable net taxes on production and imports (D2-D3) Factor income retained Income before taxes Final Income Use of Income income Resources less usesNet gain Resources less usesNet gain Resources less usesNet gain Resources less usesNet gain or loss (-) 15 or loss (-) 19 or loss (-) c or loss (-) 24 12 13 14 16 17 18 20 a b 21 175 21 316 1 220 36 22 23 25 26 136 S11 Non-financial corporations S12 Financial corporations S13 General government S14 Households S15 NPISHs 254 27 6 - 74 - 267 - 248 - 71 - 7 - 68 -205 -144 349 29 186 -178 -137 1730 33 66 213 263 - 24 - 10 42 203 263 -511 228 25 126 1219 37 -53 -4 -1 -53 -4 190 33 0 6 34 0 - 16 - 18 - 34 - 5 - 3 17 -18 -28 29 -3 -56 -1 -103 174 62 104 420 36 2 7 0 191 185 1423 29 1381 0 4 - 511 1 1 4 0 4 -1 -1 -4 -133 -191 -133 - 133 1 635 -133 1 642 residual difference (D21-D31) S1 All domestic sectors (total economy) 1 673 628 - 667 - 39 1 634 546 - 545 1 1635 191 0 73 - 76 - 3 10 S2 Rest of the world 40 55 - 16 39 79 0 - 1 - 1 78 0 0 0 78 4 - 1 3 -10 71 Total 1 713 683 - 683 0 1713 546 - 546 0 1713 191 -191 0 1 713 77 - 77 0 0 1 713 Disposable income, with net taxes on production and imports (B6g; B12 part) the income that each institutional sector used in transactions related to products and non-financial assets (produced and not produced), after considering D8, D9 and B9 income available for spending in final consumption and saving saving 20+a (net) taxes on production and imports integrate the costs of production and are collected by the general government from the producers, they allocate them to the prices of the products, paid by the purchasing sectors 228 25 317 1219 37 1 826 final income that each institutional sector has to use in transactions related to products and non-financial assets (produced and not produced) 78 1904
Institutional interrelations in distributive transactions seen through a magnifying glass. A proposal to improve national accounts data for use in input-output analysis. Santos, S. 3. Institutional sectors and distributive transactions in national accounts representation of institutional sectors throughout the distribution process 11
Institutional interrelations in distributive transactions seen through a magnifying glass. A proposal to improve national accounts data for use in input-output analysis. Santos, S. 3. Institutional sectors and distributive transactions in national accounts The distribution process can be better worked and understood if each category of distributive transactions for each institutional sector (domestic and the rest of the world) can be identified, in terms of total uses and resources institutional sectors of destination of the uses and/or origin of the resources This would allow the identification of institutional sectors contribution to the production process and its position throughout the chain of redistribution the construction of from-whom-to-whom matrices to feed numerical versions of SAMs, from which models, within or out the input-output analysis, could be constructed a better approach to the economic system in the part regarding distribution and redistribution of income 12
Aggregated social accounting matrix of transactions, with gross balancing items 13
Institutional interrelations in distributive transactions seen through a magnifying glass. A proposal to improve national accounts data for use in input-output analysis. Santos, S. 4. Construction of from-whom-to-whom matrices for distributive transactions In (distributive) transactions between institutional sectors: the resources/receipts of some are the uses/payments of others the measurement is possible both from information about the origin of the resources (from-whom), or the part received and from information about the destination of the uses (to-whom), or the part paid is not part of what is supposed to be available/published in the national accounts would allow the construction of from-whom-to-whom matrices, expanding the possibilities of disaggregating the distributive transactions in matrix representations, for possible uses in input-output analysis or others The case of the other current transfers (D7) 14
Recording in the secondary distribution of income account (supposed to be available/published in the national accounts) Total S.2 S.1 Total economy S.15 NPISHs S.14 S.13 General government S.12 S.11 Rest of the world Households Financial corporations Non-financial corporations Code Transactions and balancing items Uses Uses Uses Construction of the from-whom-to-whom matrix (possible filling in) 12D7 8D.71 D.72 D.73 D.74 4D.75 299 58 60 96 32 53 16 2 12 0 1 1 283 56 48 96 31 52 2 0 71 31 136 62 13 48 Other current transfers Net non-life insurance premiums Non-life insurance claims Current transfers within general government Current international cooperation Miscellaneous current transfers 4 96 31 5 Other current transfers (D71+D72+D73+D74+D75) S11 S12 S11 S12 S13 S14 S15 S1 0 0 S2 S1+S2 12 62 2 40 1 S13 S14 S15 S2 S1 S1+S2 Total S.11 S.12 S.13 General government S.14 S.15 NPISHs S.1 Total economy S.2 0 0 0 0 0 6 Non-financial corporations Financial corporations Households Rest of the world 62 104 36 36 244 55 299 Code Transactions and balancing items Resources Resources Resources 244 47 57 96 1 43 D7 D.71 D.72 D.73 D.74 D.75 Recording of the uses in the secondary distribution of income account, extended to destination institutional sectors (proposal) S.2 S.1 S.15 S.14 S.13 Rest of the world economy government corporations Other current transfers Net non-life insurance premiums Non-life insurance claims Current transfers within general government Current international cooperation Miscellaneous current transfers 6 62 47 15 104 36 36 55 11 3 0 31 10 299 58 60 96 32 53 0 0 0 228 55 283 16 6 1 35 0 96 1 6 136 71 2 16 0 0 1 36 Total S.12 S.11 Other current transfers (D71+D72+D73+D74+D75) S11 S12 S11 3 S12 5 10 S13 1 1 S14 0 35 S15 2 0 S1 8 50 S2 4 12 S1+S2 12 62 Total NPISHs Households General Financial Non-financial corporations S13 S14 S15 S2 S1 S1+S2 3 3 6 Code Transactions and balancing items 4 31 4 1 28 64 7 71 0 1 0 1 2 0 2 51 103 36 35 228 55 283 11 1 0 1 16 0 16 62 104 36 36 244 55 299 Uses Uses Uses 96 0 4 104 32 136 12D7 299 16 283 2 71 136 62 Other current transfers S11 - Non-Financial Corporations S12 - Financial Corporations S13 - General Government S14 - Households S15 - NPISHs S2 - Rest of the World 6 3 11 1 0 1 0 3 3 62 104 36 36 55 51 0 1 0 1 0 31 4 1 28 7 4 10 5 1 0 2 4 103 36 35 55 96 0 4 32 1 35 0 12 15
Institutional interrelations in distributive transactions seen through a magnifying glass. A proposal to improve national accounts data for use in input-output analysis. Santos, S. 5. A possible use of from-whom-to-whom matrices for distributive transactions to extend input-output analysis to income distribution Association of the from-whom-to-whom matrices to the current transactions of a disaggregated SAM dic nfc Non-financial corporations (S11) fc Financial corporations (S12) g General government (S13) h Households (S14) Non-profit institutions serving households (S15) rw Rest of the world (S2) rw D61 Net social contributions nfc 25 fc 26 g h npi 29 total S11 S12 S13 S14 S15 S2 S1 S1+S2 27 28 40 S11 S12 S13 S14 S15 S1 S2 S1+S2 66 213 50 66 213 50 66 213 50 nfc fc g h npi total 0 5 25 62 2 94 4 3 10 11 251 0 4 96 112 66 244 232 1 32 575 0 0 1 5 1 7 0 3 25 26 27 28 29 69 264 365 431 39 1 168 55 11 2 0 1 17 0 0 4 0 4 0 4 npi dic 333 333 333 0 0 0 0 0 4 333 333 0 333 276 12 216 32 D62 Social benefits other than social transfers in kind S11 S12 S11 S12 S13 S14 62 205 S15 S1 62 205 S2 S1+S2 62 205 D5 Impostos correntes sobre o rendimento, patrim nio, etc. (D51+D59) S11 S12 S13 S11 S12 S13 24 10 S14 S15 S1 24 10 S2 S1+S2 24 10 S13 S14 S15 S2 S1 S1+S2 rw 7 40 S14 S15 S2 S1 S1+S2 .. aggregated SAM 0 178 0 212 1 213 384 112 0 5 384 0 Uses/Changes in assets Economy 0 178 0 212 1 213 384 112 0 5 384 0 (rw) Rest of the world account [Tables 3.2-1,2,3,4 and 5] 0 0 0 0 Institutions accounts 0 178 0 212 1 213 112 0 5 384 0 384 Resources/ Changes in liabilities and net worth (dic) Current [Tables 3.2-3 and 4] D8 Adjustment for the change in pension entitlements S11 S12 S11 S12 S13 S14 11 S15 S1 11 S2 S1+S2 11 D7 Other current transfers (D71+D72+D73+D74+D75) S11 S12 S11 3 S12 5 10 S13 1 1 S14 0 35 S15 2 0 S1 8 50 S2 4 12 S1+S2 12 62 S13 S14 S15 S2 S1 S1+S2 S13 S14 S15 S2 S1 S1+S2 Institutions Current transactions (D5,D61, D62,D7, D8) = Economy Current transactions (D5,D61,D62,D7) = 3 3 6 (dic) Current [Tables 3.2-3 and 4] 4 31 4 1 28 64 7 71 0 1 0 1 2 0 2 51 103 36 35 228 55 283 11 1 0 1 16 62 104 36 36 244 55 299 96 0 4 104 32 136 11 11 1 168 17 (rw) Rest of the world account [Tables 3.2-1,2,3,4 and 5] 11 11 Current transactions (D5,D61,D62,D7) = 11 11 16 55 16
Institutional interrelations in distributive transactions seen through a magnifying glass. A proposal to improve national accounts data for use in input-output analysis. Santos, S. 5. A possible use of from-whom-to-whom matrices for distributive transactions to extend input-output analysis to income distribution numerical version an empirical description of the reality under study within the scope of the input-output analysis, an accounting multiplier model is a possible theoretical description of that same reality Applications of SAM-based approaches to the effects of changes associated to distribution and redistribution of income, involving the construction of scenarios representing macroeconomic impacts of possible policy measures with incidence on: (without belittling the work of other authors) (other) net taxes on the production of real estate activities (Santos, 2022a) (other) current transfers from the government to the households and households compensation of employees (Santos, 2018) factors income (labour and other) and current transactions of institutional sectors (Santos, 2018a) households unincorporated enterprises factors income (gross mixed income) (Santos, 2016) social benefits, in the form of households retirement pensions (Santos, 2014) 17 .
Institutional interrelations in distributive transactions seen through a magnifying glass. A proposal to improve national accounts data for use in input-output analysis. Santos, S. 6. Concluding remarks An economic system could be described as a vast machine which operates through decisions. Millions of people sit at the controls. Every time one of them takes a decision, a switch is turned and something happens in the machine The machine is a very complicated one, a maze of interdependence and feedback if it is to work well an economic system needs a great deal of information on which to base the innumerable decisions that have to be taken the whole time . To deal with the direct and indirect consequences of these decisions, Stone proposed the setting up of .. a system of numerical relationships connecting the facts .. two things are essential .. to combine a synoptic view of the system as a whole with specific knowledge about its parts .. to construct a working model which is so readily computable that it can be used to examine the consequences of a wide variety of assumptions and thus provide a sound framework for decisions (Stone, 1965, p.136-137) ASAM-based approach - representative of the whole economic system (is terms of transactions) .. a way of working with the national accounts within the scope of input-output analysis .. to study the part related to the distribution and redistribution of income 18
Institutional interrelations in distributive transactions seen through a magnifying glass. A proposal to improve national accounts data for use in input-output analysis. Santos, S. 6. Concluding remarks institutional interrelations in distributive transactions should be identified and available from-whom-to-whom matrices could be constructed A proposal to overcome the persistent lack of knowledge in the information published regularly, within the scope of the SNA: the extension of the national accounts data on the distributive transactions of the institutional sectors to the institutional sectors of destination of their uses (to-whom) and/or of origin of their resources (from-whom) This would provide a kind of magnifying glass applied to the distribution process, the quantification of which would make it possible to use input-output analysis in its study distribution and redistribution of income could be studied within a macroeconomic framework, involving each category of distributive transactions for each institutional sector (domestic and the rest of the world), the level of disaggregation of which could go as far as statistical secrecy, as well as sources and methods, allow This would be a starting point for deeper studies, using other sources of information 19
Institutional interrelations in distributive transactions seen through a magnifying glass. A proposal to improve national accounts data for use in input-output analysis. Santos, S. Thank you for your attention! (ssantos@iseg.ulisboa.pt) 20
Institutional interrelations in distributive transactions seen through a magnifying glass. A proposal to improve national accounts data for use in input-output analysis. Santos, S. 2. Carrying out input-output analysis in the study of income distribution with data from national accounts The SAM in endogenous and exogenous accounts matrices of flows between accounts vectors of the (corresponding) row sums L = matrix of leakages from endogenous into exogenous accounts; l = total leakages (vector) X = matrix of injections from exogenous into endogenous accounts; x = total injections (vector) i .x = i .l [i .. unitary vector (row)] the amount that the endogenous / exogenous accounts receive is equal to the amount that they spend (row totals equal column totals) yn= vector (column) of the receipts of the endogenous accounts = n + x yn = vector (row) of the expenditures of the same accounts yx= vector (column) of the receipts of the exogenous accounts = l + r yx = vector (row) of the expenditures of the same accounts 21
Institutional interrelations in distributive transactions seen through a magnifying glass. A proposal to improve national accounts data for use in input-output analysis. Santos, S. 2. Carrying out input-output analysis in the study of income distribution with data from national accounts [N = An. n] An= N. n-1 = average expenditure propensities (matrix) within endogenous accounts (or) of the uses within those accounts (the entries in the N matrix are divided by the corresponding column total) [L = Al. n] Al= L . n-1 = average expenditure propensities (matrix) of endogenous accounts in exogenous accounts (or) of the uses of endogenous accounts in exogenous accounts (the entries in the L matrix are divided by the corresponding column total) ( n: diagonal; n-1: inverse) x 22