Integrate Solarwinds with Dynatrace for Network Device Monitoring
"Learn how to extract and publish network device status, availability, and performance information from Solarwinds to Dynatrace. Take steps to query Solarwinds via API, detect abnormal status, and post events to Dynatrace AI for resolution. Understand the polling cycle, event handling, and problem resolution process. Enhance network monitoring efficiency with seamless integration between Solarwinds and Dynatrace."

Download Presentation

Please find below an Image/Link to download the presentation.
The content on the website is provided AS IS for your information and personal use only. It may not be sold, licensed, or shared on other websites without obtaining consent from the author. If you encounter any issues during the download, it is possible that the publisher has removed the file from their server.
You are allowed to download the files provided on this website for personal or commercial use, subject to the condition that they are used lawfully. All files are the property of their respective owners.
The content on the website is provided AS IS for your information and personal use only. It may not be sold, licensed, or shared on other websites without obtaining consent from the author.
E N D
Presentation Transcript
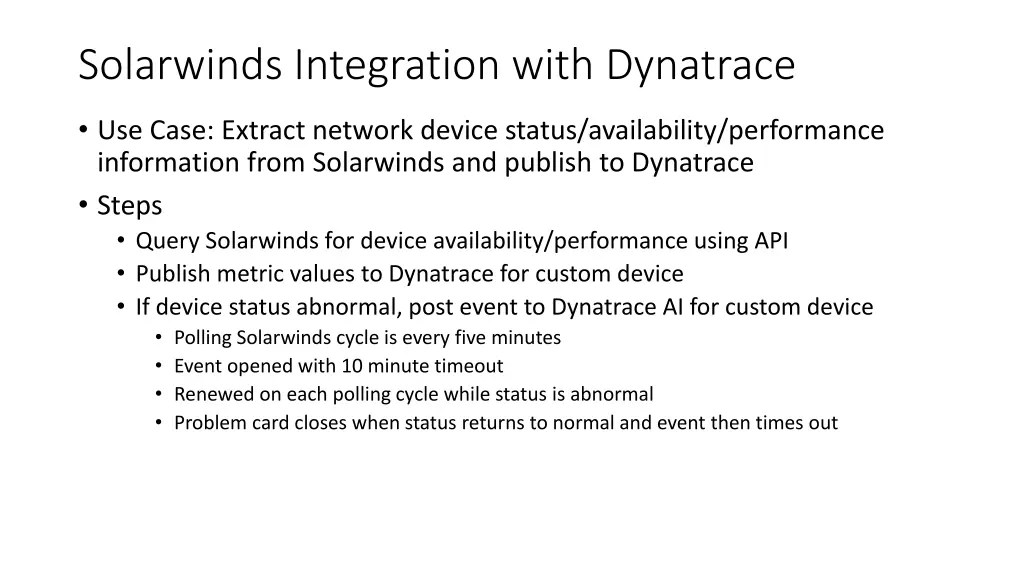
Solarwinds Integration with Dynatrace Use Case: Extract network device status/availability/performance information from Solarwinds and publish to Dynatrace Steps Query Solarwinds for device availability/performance using API Publish metric values to Dynatrace for custom device If device status abnormal, post event to Dynatrace AI for custom device Polling Solarwinds cycle is every five minutes Event opened with 10 minute timeout Renewed on each polling cycle while status is abnormal Problem card closes when status returns to normal and event then times out
Raw Response form Solarwinds Name of the device Going after Status specifically If status not equal 1 send this text as an event to Dynatrace
Solarwinds shows up as a new Technology Groups identified by Vendor
Select Group details
Scroll Down to see devices in this group
Device having issue lights up. Click into These all happen to be office printers
Additional properties from SW Status description from SW in event text
Email received for problem card Click here, takes you to next slide
The custom device name Status Description text
Legend helps to interpret Status metric Link back to Solarwinds console Link to Solarwinds Technology group