Integrated Data Analysis in Higher Education: Earnings Disparities and Policy Implications
This research explores the impact of academic skills and educational attainments on earnings gaps among students from different income backgrounds. By integrating longitudinal data, the study uncovers the nuances behind inequality in academic achievement and its implications for the labor market and public education system.

Download Presentation

Please find below an Image/Link to download the presentation.
The content on the website is provided AS IS for your information and personal use only. It may not be sold, licensed, or shared on other websites without obtaining consent from the author.If you encounter any issues during the download, it is possible that the publisher has removed the file from their server.
You are allowed to download the files provided on this website for personal or commercial use, subject to the condition that they are used lawfully. All files are the property of their respective owners.
The content on the website is provided AS IS for your information and personal use only. It may not be sold, licensed, or shared on other websites without obtaining consent from the author.
E N D
Presentation Transcript
MCAS Competency Determination and its Implications for Higher Education JOHN PAPAY BROWN UNIVERSITY FEBRUARY 2020 1 STRATEGIC GRANT PARTNERS
Using integrated data to examine policy problems Critical problem Critical problem Our evidence so far Our evidence so far MA public school students who grow up in low-income families go on to earn much less than peers who grow up in higher-income families. High school MCAS scores reflect academic skills that pay off in the labor market There are substantial gaps in educational attainments, even among students with similar academic skills Our question Our question Do academic skills and/or educational attainments account for these earnings gaps? Skill and educational attainment gaps account for most of the earnings gap 2
There is substantial (and growing) inequality in the family incomes of children attending Massachusetts public schools This family income inequality contributes to factors including: $ Parental spending gaps Residential segregation School segregation This inequality dramatically increases the challenges facing MA s PK- 20 public education system 3
Existing data systems have allowed us to analyze certain aspects of this question % Meets/Exceeds Expectations (2019) % Enroll in College* 70 72 46 36 Higher income Low income Higher income Low income This evidence is suggestive, but piecemeal. Integrating datasets over time and across agencies enables much more nuanced answers to inform policy * Enrollment in two- or four-year college four years post MCAS, among 2015 first-time 10th grade test takers 4
Integrated, longitudinal data allows for much more nuanced and detailed analysis College/Work Workforce High School Student from higher income family $49,888 Student from lower income family $35,909 Age 16 18 20 22 24 26 28 30 32 2019 2003 MCAS How can this dataset inform our policy problem? Do academic skills and/or educational attainments account for these large earnings gaps for students who grew up in higher- and low-income families? 5
High school MCAS scores reflect academic skills that pay off in the labor market 6
MCAS scores reflect academic skills that pay off in the labor market We look at median annual earnings ~ age 30 for students at each MCAS score Students with higher MCAS scores go on to earn substantially more in the labor market. NOTE: We only observe in-state earnings reported to the UI system. This excludes self-employed individuals or those who work for the federal government or military. Living Wage from MIT estimates for two working parents with two children. 7
MCAS scores reflect academic skills that pay off in the labor market We look at median annual earnings ~ age 30 for students at each MCAS score 75th Percentile Students with higher MCAS scores go on to earn substantially more in the labor market. 25th Percentile Is this simply because students with higher MCAS scores tend to go to college, or because they have different demographic profiles? NOTE: We only observe in-state earnings reported to the UI system. This excludes self-employed individuals or those who work for the federal government or military. Living Wage from MIT estimates for two working parents with two children. 8
MCAS scores predict educational attainments Steep relationship between MCAS scores and attainments. Only 19% of students scoring at the 25th percentile in 2003-05 graduate from a four- year college (within 7 years of taking the test), compared to nearly 67% of students scoring at the 75th percentile. NOTE: We measure HS graduation within 3 years of taking the 10th grade test, college attendance within 4 years, and college graduation within 7 years. 9
MCAS scores predict earnings even if we compare students with the same educational attainments same educational attainments and demographics demographics We compare students with similar demographics from the same high school. Earnings Premium Associated with MCAS Scores Four-Year College Graduates* Advanced +14% There are large financial returns to MCAS scores for students with similar attainments. Proficient NI -11% Failing -20% *We look at FY2019 earnings for first-time 10th grade test takers in 2003-05. N: Failing=888; NI=8,402; P=20,904; A=37,317. 10 10
MCAS scores predict earnings even if we compare students with the same educational attainments same educational attainments and demographics demographics We see similar patterns across all levels of attainment. We see strong financial returns to educational attainments (particularly four-year college degrees) for students at the same MCAS score level. 11 11 *We look at FY2019 earnings for first-time 10th grade test takers in 2003-05. 4-yr College Graduates N: Failing=888; NI=8,402; P=20,904; A=37,317. 2-yr HS Graduates N: Failing=583; NI=1,843; P=1,515; A=466. Terminal HS Graduates N: Failing=8,507; NI=14,943; P=9,172; A=5,395. 11
Improvements in skills reflected in MCAS score improvements between 8th and 10th grade predict longer-term outcomes We compare students with similar 8th grade MCAS scores Those who have higher 10th grade MCAS scores go on to earn more ~15 years later $$ $ 8th Grade MCAS 10th Grade MCAS Age 30 Earnings Among students with similar 8th grade scores, scoring 1 SD higher in 10th grade is associated with a 12% difference in later earnings. 12 12
There are substantial gaps in educational attainments, even among students with similar academic skills 13
Among MA public high school graduates, 30% of low-income students first enroll in a 4-year college (vs. 60% for higher-income students) 4yr MA public No college 2yr MA public 4yr Other 2yr Other $ Low Income 42% 26% 1% 13% 17% N = 32,343 Non-low Income $$$ 22% 17% 1% 20% 40% N = 143,841 *Among MA public high school graduates who took 10th grade MCAS (2003-05). 14 14
Among low-income students who enter a two-year college shortly after high school, almost 80% have no credential 5 years later. Among students who first enter MA public 4-yr college $ Graduate (within 7 years of MCAS) 48% Among students who first enter MA public 2-yr college Graduate, do not transfer to 4yr Income 20% Low Graduate, transfer to 4yr, and graduate Graduate, transfer to 4yr, but no degree .1% .3% N = 32,343 Transfer to 4yr and graduate .9% Transfer to 4yr but no degree 3% Among students who first enter MA public 4-yr college Graduate (within 7 years of MCAS) Among students who first enter MA public 2-yr college Graduate, do not transfer to 4yr 63% $$$ Non-low Income 26% .2% .6% 3% Graduate, transfer to 4yr, and graduate Graduate, transfer to 4yr, but no degree Transfer to 4yr and graduate N = 143,841 Transfer to 4yr but no degree 4% 15 15
There are striking gaps in 4-year college completion by family income, even among students with similar MCAS scores At the median MCAS score, higher-income students are 21 percentage points more likely to graduate from a 4-year college than low-income students. 16
Income-based gaps in completion exist for students who enroll at Massachusetts public four-year universities enroll Among students who enroll at MA public four-year universities, students who grew up in low-income families are much less likely to graduate than their peers with the same MCAS scores who grew up in higher-income families. 17
Skill and educational attainment gaps account for most of the earnings gap 18
Comparing students with the same MCAS scores and attainments, earnings gaps are quite small Four-year college graduates from low-income families have similar later earnings as higher- income college graduates with the same MCAS math scores. This pattern holds for graduates of MA public 4-year colleges. Note: data from MCAS, SIMS, NSC college-going records, and DUA wage records 19
Comparing students with the same MCAS scores and attainments, earnings gaps are quite small We see similar patterns across lines of difference in the Commonwealth. Comparison for 2003-05 test-takers Overall Gap in 2019 earnings Gap conditional on MCAS scores and attainment Low-income (vs. higher income) -31% -7% (-$15,000) (-$3,500) Black (vs. non-Hispanic white) -31% -9% (-$15,000) (-$4,500) Hispanic (vs. non-Hispanic white) -28% 1.1% (+$500) (-$14,000) English Learner (in grade 10) vs. Non-EL -16% +18% ($2,650) (-$10,000) 20
Educational attainments are rising for all groups, but gaps in four-year college attainment rate are widening Educational attainments are rising for all groups, but gaps in four-year college attainment rate appear to be widening Educational attainments have risen for all groups Gaps in high-school graduation have narrowed from 18 to 10% points. Gaps in 4-year college attainment have grown from 28 to 35% points. Similar patterns across other lines of difference. 21
Summary and next steps Summary High school MCAS scores reflect academic skills that pay off in the labor market There are substantial income-based gaps in educational attainments, even among students with similar academic skills Skill and educational attainment gaps account for most of the disparity in later average earnings Income-based gaps in HS completion are narrowing, but gaps in 4-year college completion are growing. Next steps Additional evidence to inform competency determination policy (DESE) Analysis of time to completion and labor market returns to MA community colleges 22
Appendix 23 STRATEGIC GRANT PARTNERS
These gaps not only reflect gaps in enrollment, but gaps in completion for students who do enroll in a 4-year college Among students who t the median MCAS score, higher-income students are 21 percentage points more likely to graduate from a 4-year college than low-income students. 24


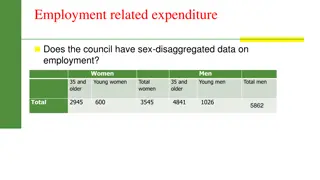
 inequality in the family")