Integrated Performance Report - People Data Insights
A detailed report on interpreting statistical process control charts and summary icons for guiding board-level conversations and decision-making. The report highlights crucial patterns in data visualization, distinguishing between natural variation and concerning trends that require investigation and action. It emphasizes the importance of understanding and improving performance metrics for effective decision-making and continuous improvement strategies.

Download Presentation

Please find below an Image/Link to download the presentation.
The content on the website is provided AS IS for your information and personal use only. It may not be sold, licensed, or shared on other websites without obtaining consent from the author.If you encounter any issues during the download, it is possible that the publisher has removed the file from their server.
You are allowed to download the files provided on this website for personal or commercial use, subject to the condition that they are used lawfully. All files are the property of their respective owners.
The content on the website is provided AS IS for your information and personal use only. It may not be sold, licensed, or shared on other websites without obtaining consent from the author.
E N D
Presentation Transcript
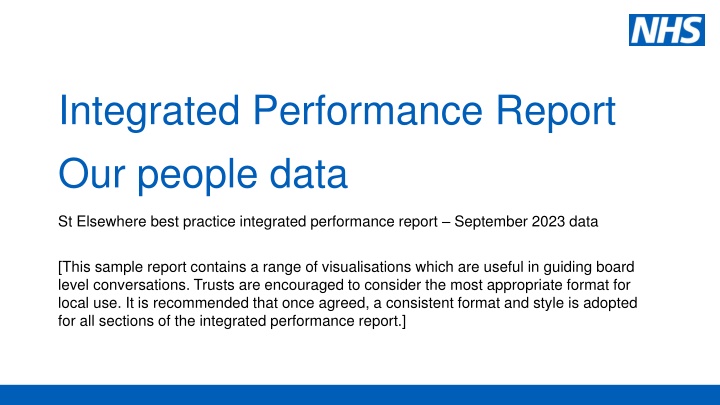
Integrated Performance Report Our people data St Elsewhere best practice integrated performance report September 2023 data [This sample report contains a range of visualisations which are useful in guiding board level conversations. Trusts are encouraged to consider the most appropriate format for local use. It is recommended that once agreed, a consistent format and style is adopted for all sections of the integrated performance report.]
Interpreting SPC charts A statistical process control (SPC) chart is a useful tool to help distinguish between signals (which should be reacted to) and noise (which should not as it is occurring randomly). The following colour convention identifies important patterns evident within the SPC charts in this report. Orange there is a concerning pattern of data which needs to be investigated and improvement actions implemented Blue there is a pattern of improvement which should be learnt from Grey the pattern of variation is to be expected. The key question to be asked is whether the level of variation is acceptable The dotted lines on SPC charts (upper and lower process limits) describe the range of variation that can be expected. Concerning variation Expected variation Process limits are very helpful in understanding whether a target or standard (the red line) can be achieved always, never (as in this example) or sometimes. UPL Average LPL Improving variation SPC charts therefore describe not only the type of variation in data, but also provide an indication of the likelihood of achieving target. Target To be less than Summary icons have been developed to provide an at-a-glance view. These are described on the following page. Integrated Performance Report - Our People Data 2
Interpreting summary icons These icons provide a summary view of the important messages from SPC charts. Variation / performance Icons Icon Technical description What does this mean? What should we do? This system or process is currently not changing significantly. It shows the level of natural variation you can expect from the process or system itself. Consider if the level/range of variation is acceptable. If the process limits are far apart you may want to change something to reduce the variation in performance. Common cause variation, NO SIGNIFICANT CHANGE. Investigate to find out what is happening / has happened. Is it a one off event that you can explain? Or do you need to change something? Special cause variation of a CONCERNING nature. Something s going on! Something, a one-off or a continued trend or shift of numbers in the wrong direction Find out what is happening / has happened. Celebrate the improvement or success. Is there learning that can be shared to other areas? Special cause variation of an IMPROVING nature. Something good is happening! Something, a one-off or a continued trend or shift of numbers in the right direction. Well done! Assurance icons Technical description What does this mean? What should we do? Icon The process limits on SPC charts indicate the normal range of numbers you can expect of your system or process. If a target lies within those limits then we know that the target may or may not be achieved. The closer the target line lies to the mean line the more likely it is that the target will be achieved or missed at random. This process will not consistently HIT OR MISS the target as the target lies between the process limits. Consider whether this is acceptable and if not, you will need to change something in the system or process. You need to change something in the system or process if you want to meet the target. The natural variation in the data is telling you that you will not meet the target unless something changes. This process is not capable and will consistently FAIL to meet the target. If a target lies outside of those limits in the wrong direction then you know that the target cannot be achieved. Celebrate the achievement. Understand whether this is by design (!) and consider whether the target is still appropriate; should be stretched, or whether resource can be directed elsewhere without risking the ongoing achievement of this target. This process is capable and will consistently PASS the target if nothing changes. If a target lies outside of those limits in the right direction then you know that the target can consistently be achieved. Integrated Performance Report - Our People Data 3
Interpreting the Data Quality Indicator The indicator provides an effective visual aid to quickly provide analysis of the collection, review and quality of the data associated with the metric. Each metric is rated against the 3 domains in the table below and displayed alongside the SPC chart as in the below example. Symbol Domain Definition Has the logic and validity of the data definition been assessed and agreed by people of appropriate and differing expertise? Has this definition been reviewed regularly to capture any changes e.g. new ways of recording, new national guidance? Is the required data available and up to date at the point of reporting? Are all the required data values captured and available at the point of reporting? Is there a process to assess the validity of reported data using business logic rules? Is data collected in a structured format using an appropriate digital system? Sign off and Review S Timely and Complete T Process and System P Integrated Performance Report - Our People Data 4
Executive summary: our people The overall trust vacancy rate reduced over the past 7 months as a result of the significant increase in nurses being recruited (mainly in medicine). There was a significant and unexpected increase in agency usage in September which is currently being investigated. Related to the reduction in vacancies, the turnover rate has reduced since April and our regional position has improved with us now having the 4th highest turnover rate. Thematic analysis from exit interviews is ongoing to inform actions to improve this position. The trust has seen an increased level of joiners for over a year, however the target continues to be unachievable. One of the unforeseen consequences of this has been an increase in the time to hire new staff as the Recruitment team has been unable to process the volume of applications in a timely manner. There has been a concerning increase in overall sickness despite an improvement in short term sickness due to the successful Get up and go programme. The impact of this programme and overall effectiveness of absence policies are being evaluated. Long term sickness remains a concern. Staff are being actively supported and 20 are due to return to work imminently. While there has been a sustained increase in staff declared disabled, this does not reflect figures reported in the staff survey. Work has started to understand the cause of this discrepancy. Our analysis shows that the percentage of BME staff in post does not reflect our wider population. We need to ensure our workforce is much more diverse and representative of the communities we serve, and an action plan is being developed. There has been a significant improvement in appraisal compliance rates, however a considerable amount of additional work is necessary if the target of 85% is to be achieved (current performance 69%). Mandatory training rates remain unchanged overall (current performance 95%). There have been improvements in infection prevention and control, fire and equality training. Information governance training is failing the target and also currently deteriorating. The CIO is prioritising actions to address this. Integrated Performance Report - Our People Data 5
Our people domain matrix Assurance Pass Flip flop Fail No Target % Short term sickness / absence % Vacancy in month % Turnover in month % Appraisal compliance Reigstered nurse fill rate % BME Staff in Post % Trust staff declared disabled Number of joiners in month Variation % Mandatory training compliance same % Sickness / absence in month % Long term sickness / absence Time to hire in days mean % Agency rate Integrated Performance Report - Our People Data 6
Our people staffing summary Staffing Summary Icon Table Assurance Data quality assessment Variation Latest month Data Quality Indicators Metric Measure Target Mean A range of potential quality issues have been identified with the data on BME staff in post. These include delays in recording, the robustness of validity checks and the indicator definition. Resolving these issues is the top priority for the DQ Improvement Taskforce. % Vacancy In-month Sep 23 10.7% 12.0% 10.9% % Registered nurse fill rate Sep 23 95.1% 85.0% 93.4% % Agency rate Sep 23 5.3% 3.7% 4.3% Given the discrepancy with staff survey figures, there are concerns with the process for validating the staff declared disabled data. Further investigation is currently underway. % BME Staff in Post Sep 23 7.3% - 7.7% % Trust staff declared disabled Sep 23 4.7% - 4.6% Sickness and Absence Summary Icon Table Assurance Data quality assessment Variation Latest month Data Quality Indicators Metric Measure Target Mean A review is currently being undertaken to ensure short term sickness data consistently adheres to the agreed definition. % Sickness / absence in month Sep 23 6.5% 5.0% 6.3% % Long term sickness / absence Sep 23 2.7% 1.0% 2.5% % Short Term Sickness / Absence In-month Sep 23 2.3% 3.0% 3.2% Integrated Performance Report - Our People Data 7
Our people staffing Metric Grouping Value Var. Ass. Target Metric Grouping Value Var. Ass. Target Metric Grouping Value Var. Ass. Target Vacancy Trust 10.7% 12.0% Nursing Fill Rate Trust 95.1% 80.0% Agency Rate Trust 5.3% 3.7% Vacancy Nursing 10.8% 12.0% Nursing Fill Rate Medicine Division 95.9% 80.0% Agency Rate Medicine Division 8.7% 3.7% Vacancy Doctors 9.1% 12.0% Nursing Fill Rate Surgical Division 87.2% 80.0% Agency Rate Surgical Division 4.2% 3.7% Vacancy Clinical Support 12.5% 12.0% Nursing Fill Rate Womens & Children Division 98.3% 80.0% Agency Rate Womens & Children Division 4.8% 3.7% Vacancy Admin & Clerical 13.1% 12.0% Understanding the performance Actions (SMART) Risks A sustained improvement in the trust vacancy rate has been driven by improvement in nursing. Clinical support and admin have seen a concerning deterioration and are unable to achieve the target. Over the next month, focused work to understand the: With the approach of winter, there is a risk that an increase in sickness rates may result in an additional requirement to use agency staff. To mitigate this risk, work is currently being undertaken to encourage clinical staff to register with the bank. deterioration in vacancy rate for clinical support and admin deterioration in nursing fill rate in surgery actions undertaken in medicine leading to the improvement in nursing fill rate which could be implemented in other divisions reason for the increase in agency usage for medicine Funded establishment is currently 300 WTE below plan with nursing remaining the area of most challenge. In addition, processes are being put in place to ensure that shifts are only supported by agency staff where absolutely necessary. Over the coming months, agency spend by ward will be reviewed on a weekly basis by HR business partners. The significant increase in agency use last month was driven by medicine. Further work is required to understand this given the improvements in nursing fill rate. The CNO has taken responsibility for these actions and will provide an update on actions being taken at the next meeting. Integrated Performance Report - Our People Data 8
Our people staffing Understanding the performance Actions (SMART) Risks There has been no significant change in % BME staff in post since April 2021. The variation can be expected to range between 5.7% and 9.8%. The most recent population demographic indicates BME levels at 15%. Further work should therefore be undertaken to increase the level of BME staff. The business intelligence team is undertaking detailed analysis to understand the breakdown of BME staff and compare this to the population demographic. The Director of People will report on this analysis and associated action plan at the November people committee. There is a risk that a number of disabled staff are not being provided with adequate support as they have not declared their disability with the People team. Mitigating actions will be put in place once more information is known about this discrepancy. A sustained improvement in declared disabled staff in post was due to a successful campaign in the spring. The range of variation is now 4.1% to 5.2%. Results from the recent staff survey indicate that 20% of staff identify as disabled. Further work is required to understand this difference. Work is also underway to try and understand the significant gap in declared staff disabled. An update will be provided at the next board meeting by the Director of People. Integrated Performance Report - Our People Data 9
Our people sickness and absence Metric Grouping Value Var. Ass. Target Metric Grouping Value Var. Ass. Target Metric Grouping Value Var. Ass. Target Sickness In-month Trust 6.5% 5.0% Long Term Sickness In-month Trust 2.7% 1.0% Short Term Sickness In-month Trust 2.3% 3.0% Sickness In-month Medicine Division 6.7% 5.0% Long Term Sickness In-month Medicine Division 3.2% 1.0% Short Term Sickness In-month Medicine Division 2.0% 3.0% Sickness In-month Surgical Division 6.9% 5.0% Long Term Sickness In-month Surgical Division 2.8% 1.0% Short Term Sickness In-month Surgical Division 2.8% 3.0% Sickness In-month Womens & Children Division 8.2% 5.0% Long Term Sickness In-month Womens & Children Division 3.0% 1.0% Short Term Sickness In-month Womens & Children Division 3.0% 3.0% Understanding the performance Actions (SMART) Risks There has been a concerning increase in sickness over the past 8 months this is despite significant improvement in short term sickness. The key driver for the deterioration in overall sickness is the increase in long term sickness primarily in the medicine and surgery divisions over recent months. The improvement in short term sickness has been a result of the Get up and get fit programme implemented recently which has been popular with staff. Options are being investigated to support improvements in staff mental health and wellbeing as this is the biggest contributor to sick days (see slide 8). With winter approaching there is a risk that sickness rates will increase which will have an impact on our ability to deliver to expected standards of care. The situation will be closely monitored and bank staff used to ensure that shifts are adequately resourced. Individual staff members on long term sick leave are being actively supported and have regular reviews. 20 members of staff have a staged planned return to work in October. The Director of People will provide an update at the next meeting. The target for sickness and long term sickness remains unachievable. Short term sickness has achieved the target for 3 months. Integrated Performance Report - Our People Data 10
Our people sickness and absence reasons Pareto Key contributors Mental health Musculoskeletal Back problems Cough / Cold / Flu Gastrointestinal Injury / Fracture Headache / Migraine Integrated Performance Report - Our People Data 11
Our people turnover and development summary Turnover and Hiring Summary Icon Table Assurance Data quality assessment Variation Latest month Data Quality Indicators Metric Measure Target Mean The time to hire data is currently held in a spreadsheet maintained by the Recruitment team so the data is not easily accessible to the Business Intelligence team. A project has been established to record this data on the main HR system and at the same time ensure that the validation processes and indicator definition are formalised and documented. % Turnover in month Sep 23 1.4% 1.0% 1.6% Number of joiners in month Sep 23 134 - 128 Time to hire in days mean Sep 23 45.5 30.0 38.4 Training and Appraisal Summary Icon Table Assurance Data quality assessment Variation Latest month Data Quality Indicators Metric Measure Target Mean The mandatory training data is held in a separate database historically managed by the Development and Training team. This database is currently being transferred to the Business Intelligence team who will maintain it going forward. % Appraisal compliance Sep 23 58.1% 85.0% 56.1% % Mandatory training compliance Sep 23 95.0% 90.0% 91.6% Integrated Performance Report - Our People Data 12
Our people turnover and vacancy Understanding the performance Actions (SMART) Risks There has been a reduction in staff turnover since April 2023. Current performance is 1.4% against a target of 1% so further work is necessary for the target to be achieved. The trust has the 4th highest rate compared to regional peers (best performance is 0.84%). The People Committee has tasked the workforce intelligence team to provide a further breakdown of data for all three measures. They will be considering this at the next committee meeting and provide any items for escalation to the November board. None requiring consideration by the board. There has been a significant and sustained increase in new joiners. Process limits have therefore been recalculated. There has been an associated decline in time to hire times as the Recruitment Team has been unable to process the necessary paperwork as quickly. The target cannot be achieved. Process mapping is scheduled for mid October with the intention of implementing improved processes to reduce the time to hire. It is hoped that improvement will be evidenced in the data by December. Integrated Performance Report - Our People Data 13
Our people turnover regional benchmarking Narrative Low is Good Trust performance has improved over the past 12 months when we had the highest turnover rate in the region. The Director of People will be implementing additional actions over the coming year to improve this position further. The workforce intelligence team will provide an updated position to the board quarterly. Integrated Performance Report - Our People Data 14
Our people training and appraisal Metric Grouping Value Var. Ass. Target Mandatory Training Trust 95.0% 90.0% Mandatory Training Conflict Resolution 95.9% 90.0% Mandatory Training Equality, diversity and human rights 97.8% 90.0% Mandatory Training Fire safety 89.5% 90.0% Mandatory Training Health, safety and welfare 90.0% 90.0% Mandatory Training Infection prevention and control 97.0% 90.0% Mandatory Training Information governance 86.8% 90.0% Mandatory Training Moving and handling 94.1% 90.0% Mandatory Training Preventing Radicalisation 99.1% 90.0% Mandatory Training Resuscitation 98.7% 90.0% Mandatory Training Safeguarding Adults 97.2% 90.0% Mandatory Training Safeguarding Children 99.4% 90.0% Metric Grouping Value Var. Ass. Target Metric Grouping Value Var. Ass. Target Appraisal Compliance Trust 69.0% 85.0% Mandatory Training Trust 95.0% 90.0% Appraisal Compliance Nursing 51.7% 85.0% Mandatory Training Medicine Division 91.1% 90.0% Appraisal Compliance Doctors 71.2% 85.0% Mandatory Training Surgical Division 87.5% 90.0% Appraisal Compliance Clinical Supoprt 56.1% 85.0% Mandatory Training Womens & Children Division 96.6% 90.0% Appraisal Compliance Admin & Clerical 37.6% 85.0% Understanding the performance Actions (SMART) Risks There has been a significant month on month improvement in appraisal compliance since April 2023. Current performance, however, is significantly below the target of 85%. Lowest levels of compliance are in admin, nursing and clinical support (which has deteriorating performance). The Chief Nursing Officer: has established an appraisal task and finish group to review data on a fortnightly basis and escalate concerns to relevant directors as necessary is exploring what has led to the improvement in mandatory training in surgery with a view to spread the learning is working with estates to improve fire safety training levels further has escalated the issue of IG training to the CIO There is a particular risk associated with the relatively low level of compliance with information governance mandatory training compliance levels. This is a high priority for the Chief Information Officer and training levels are expected to be compliant within the next month. Figures will be closely monitored on a weekly basis and action taken as is necessary. Mandatory training compliance remains unchanged since April 2021. The target will be achieved at random. Further work is necessary to improve performance as this measure can have an impact on quality of care. A report will be presented on all issues at the November board. Integrated Performance Report - Our People Data 15
Metric glossary and definitions Improvement Direction Metric Definition Methodology / Exclusions Data Source Up Number of WTE Up Registered nurse fill rate Down % Agency rate Neither % BAME staff in Post Neither % Trust staff who are declared disabled Down % Sickness / absence in month Down % Long term sickness / absence Down Days lost per WTE mean Down % Turnover in month Down Number of leavers in month Up Number of joiners in month Down Time to hire in days mean Down % Vacancy in month Up % Appraisal compliance Up % Mandatory training compliance Integrated Performance Report - Our People Data 16