Explore the Mediated Modelling approach integrating cultural, social, economic, and environmental aspects of well-being in Auckland to support spatial planning. The Sustainable Pathways 2 Project aims to offer tools for integrated decision-making. Discover the System Dynamics Model reflecting stakeholders' views and the causal loop diagrams depicting the story of the Auckland region.
Please find below an Image/Link to download the presentation.
The content on the website is provided AS IS for your information and personal use only. It may not be sold, licensed, or shared on other websites without obtaining consent from the author. If you encounter any issues during the download, it is possible that the publisher has removed the file from their server.
You are allowed to download the files provided on this website for personal or commercial use, subject to the condition that they are used lawfully. All files are the property of their respective owners.
The content on the website is provided AS IS for your information and personal use only. It may not be sold, licensed, or shared on other websites without obtaining consent from the author.
E N D
Presentation Transcript
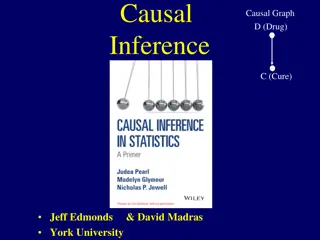
Mediated Modelling Integrating the four aspects of well-being in Auckland to support Spatial Planning
Sustainable Pathways 2 Project Goal: to provide synergistic tools to support integrated, decision making in Auckland and Wellington. Outputs: 1. A system dynamics model that can be used by a wide range of stakeholders 2. A spatial decision support system operated by council staff Both models allow the simulation of development pathways and visualisation of future change.
The System Dynamics Model This model was developed using mediated modelling and therefore reflects the views of the stakeholders involved It integrates the four aspects of well-being (cultural, social, economic and environmental) The feedback loops and delays can be described using a Causal Loop Diagram as follows:
Population & cultural diversity + + Education R1 Education Drives Growth + Employment Economics Attractiveness Funding Under the anticipated population growth scenarios about 60,000 new students will need education. When more children are educated, they have more chance of being employed resulting in more economic activity and therefore a more attractive region. The latter will foster more migration to the region resulting in a reinforcing feedback loop.
Population & cultural diversity + + Education R1 + Education Drives Growth R2 health Education Improves Health which Drives Growth + + Employment Economics Attractiveness Funding Education also improves health which in turn improves employment, the regional economy and the attractiveness of the region.
Population & cultural diversity + + Education R1 + Education Drives Growth R2 health Education Improves Health which Drives Growth + + Employment Economics Attractiveness Funding + R3 Employment generates taxes for the restoration of Natural Capital Natural Capital + + Governance or policies solutions More people employed and an attractive regional economy increases the public funds (such as taxes due to more inhabitants) that can be derived from this economy. More funds can e.g. Be spend on the restoration of natural capital. However, it takes time to restore natural capital and derive ecosystem service benefits!
The next loop in this diagram is a balancing loop as population growth puts pressure on the health care system (e.g. more people, as a fraction of a growing population, require health care services. How well the healthcare services meet the demand for healthcare services, in turn impacts employment and the regional economy. If demand is higher than supply a negative impact on the attractiveness of the region emerges through unemployment affecting migration flows lowering the population. B1 Population & cultural diversity Population Growth sets pressure on Health System + + Education R1 - + Education Drives Growth R2 health increased Education Improves Health which Drives Growth + + Employment Economics Attractiveness Funding + R3 Employment generates taxes for the restoration of Natural Capital Natural Capital + + Governance or policies solutions
B1 Population & cultural diversity Population Growth sets pressure on Health System + + Education R1 - + Education Drives Growth R2 health Education Improves Health which Drives Growth A second balancing loop is related to population growth affecting natural capital though urbanisation. B2 + negatively Population Growth sets pressure on Natural Capital + Employment Economics Attractiveness Funding + R3 Employment generates taxes for the restoration of Natural Capital - Natural Capital + + Governance or policies solutions
Population currently chosen as a proxy for deprivation and poverty influencing housing . This impacts ethnic differently and impacts on Education (and Health). density is + B3 Social B1 (e.g., Housing crowding) Population & cultural diversity Crowding impacts education Population Growth sets pressure on Health System - groups thereby + + Education R1 - + Education Drives Growth R2 health Education Improves Health which Drives Growth B2 + Population Growth sets pressure on Natural Capital + Employment Economics Attractiveness Funding + R3 Employment generates taxes for the restoration of Natural Capital - Natural Capital + + Governance or policies solutions
+ B3 Social B1 (e.g., Housing crowding) Population growth also demands more transport. Population & cultural diversity Crowding impacts education Population Growth sets pressure on Health System - + + Education R1 - + Education Drives Growth R2 health Education Improves Health which Drives Growth B2 + Population Growth sets pressure on Natural Capital + + Employment Economics Attractiveness Funding Transport + R3 Employment generates taxes for the restoration of Natural Capital - Natural Capital + + Governance or policies solutions
+ B3 Social B1 (e.g., Housing crowding) Population & cultural diversity Crowding impacts education Population Growth sets pressure on Health System - + + Education R1 - + Education Drives Growth R2 health Education Improves Health which Drives Growth B2 + Population Growth sets pressure on Natural Capital + + Employment Economics Attractiveness Funding Transport + + R3 Employment generates taxes for the restoration of Natural Capital - Natural Capital + + Natural active mode in transport, which impacts on Health, i.e. Reducing the fraction of young and requiring health services. Capital affects Governance or policies solutions elderly care
+ B3 Social B1 (e.g., Housing crowding) Population & cultural diversity Crowding impacts education Population Growth sets pressure on Health System - + + Education R1 - + Education Drives Growth R2 health ? Education Improves Health which Drives Growth B2 + Population Growth sets pressure on Natural Capital + + Employment Economics Attractiveness Funding Transport + + R3 Employment generates taxes for the restoration of Natural Capital - Natural Capital + + Governance or policies solutions Transport impacts health through active mode (and emissions).
External (e.g., change) population growth. factors climate impact + External Factors (e.g., climate change) B3 + Social B1 (e.g., Housing crowding) Population & cultural diversity Crowding impacts education Population Growth sets pressure on Health System - + + Education R1 - + Education Drives Growth R2 health ? Education Improves Health which Drives Growth B2 + Population Growth sets pressure on Natural Capital + + Employment Economics Attractiveness Funding Transport + + R3 Employment generates taxes for the restoration of Natural Capital - Natural Capital + + Governance or policies solutions
+ External Factors (e.g., climate change) B3 + Social B1 (e.g., Housing crowding) Population & cultural diversity Crowding impacts education Population Growth sets pressure on Health System - - + + Education R1 - + Education Drives Growth R2 health ? Education Improves Health which Drives Growth B2 + Population Growth sets pressure on Natural Capital + + Employment Economics Attractiveness Funding Cultural ? Transport + + R3 Employment generates taxes for the restoration of Natural Capital - Natural Capital + + Governance or policies solutions Reminder Culturalsector into this causal loop diagram to link the
+ External Factors (e.g., climate change) B3 + Social B1 (e.g., Housing crowding) Population & cultural diversity Crowding impacts education Population Growth sets pressure on Health System - + + Education R1 - + Education Drives Growth R2 health ? Education Improves Health which Drives Growth B2 + Population Growth sets pressure on Natural Capital + + Employment Economics Attractiveness Funding Cultural ? Transport + + R3 Employment generates taxes for the restoration of Natural Capital - Natural Capital + + Governance or policies solutions THE END!
Conclusions Interlinkages and time lags are important to future outcomes. The Causal Loop Diagram is one way to visualise the important linkages and time lags built into the system dynamics model. The Story underlying the Causal Loop Diagram allows stakeholders to communicate the interlinkages and time lags to others.