Integrating Gender Perspective in Work Statistics
Focusing on gender disparities in work and labor market statistics, this content explores strategies for enhancing data relevance, quality, and understanding of gender differences. It emphasizes the importance of comprehensive coverage, improved data quality, and highlighting gender issues in data presentation.

Download Presentation

Please find below an Image/Link to download the presentation.
The content on the website is provided AS IS for your information and personal use only. It may not be sold, licensed, or shared on other websites without obtaining consent from the author.If you encounter any issues during the download, it is possible that the publisher has removed the file from their server.
You are allowed to download the files provided on this website for personal or commercial use, subject to the condition that they are used lawfully. All files are the property of their respective owners.
The content on the website is provided AS IS for your information and personal use only. It may not be sold, licensed, or shared on other websites without obtaining consent from the author.
E N D
Presentation Transcript
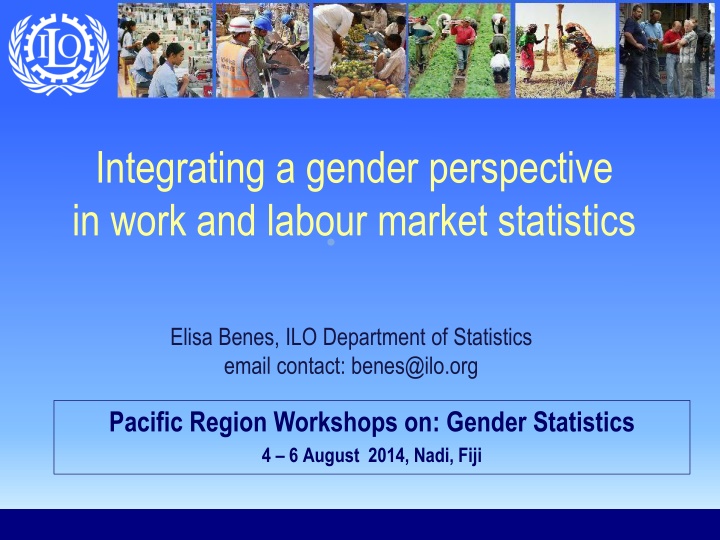
Integrating a gender perspective in work and labour market statistics Elisa Benes, ILO Department of Statistics email contact: benes@ilo.org Pacific Region Workshops on: Gender Statistics 4 6 August 2014, Nadi, Fiji
What the statistics show TOTAL Men Women Men Women Men Women URBAN RURAL 2 ILO Department of Statistics
Gender mainstreaming in work statistics -What does it mean? Process of evaluating & improving existing data to enhance its capacity to reflect differences & similarities between women & men in the world of work 3 ILO Department of Statistics
How to make work statistics more gender relevant? A. Ensure comprehensive coverage of gender issues Producing data disaggregated by sex is not enough! Identify gender issues in the world of work Identify available data sources & gaps B. Improve quality of work statistics from a gender perspective Frameworks, concepts, definitions that recognize differences Methods that reduce underreporting & misclassification C. Facilitate understanding of gender differences Highlight gender issues in presentation of data Often requires detailed disaggregation to identify differences
A. Ensure comprehensive coverage Scope & objectives of work statistics Identify gender issues Identify data needs to address gender issues Assess existing sources of data 6 ILO Department of Statistics
Work & Labour market statistics: Scope and objectives (19th ICLS, 2013) Describe and monitor labour markets Participation in employment, characteristics, working conditions Extent of underutilization, labour market access and integration Measure & participation in all forms of work (paid & unpaid) Contribution to economy (national accounts / satellite accounts) Contribution to household livelihoods and wellbeing Assess differences in participation Urban / rural , women / men, children / youth / adults, etc. 7 ILO Department of Statistics
Identify gender issues Data needs Forms of work performed (paid & unpaid) Labour force status Barriers to labour force entry Occupation, industry, employment status Union membership Occupational injuries Earnings, working time, benefits, social security Gender differences -Levels & patterns of work and labour market participation -Characteristics of the work -Working conditions -Contributions & returns from work Personal & context variables Education Family constraints Intra-household & gender roles Community expectations Access to physical & financial assets Discrimination on the job market And in the workplace -Age, sex, education, marital status -Family constraints (presence of children by age groups, other dependent members, child care ) -Area context (urban /rural, regions) -Personal ownership of assets (land, livestock) -Employment experience, seniority
Identify gender issues: 4 dimensions 1. Forms of work (paid & unpaid) carried out 2. Labour market access / exit 3. Characteristics and conditions of work 4. Contributions and returns for their work 9 ILO Department of Statistics
1. Forms of work (paid & unpaid) carried out Do they engage in work for pay or profit? Employment Do they provide unpaid household services? Own-use providers of services Do they engage in subsistence agriculture, fishing? Own-use producers of goods, subsistence foodstuff producers Do they participate in unpaid community / village work? Volunteer work
Illustration: Forms of work 11 ILO Department of Statistics
2. Labour market access Do they have work for pay / profit ? Employment Do they look / are available for work for pay / profit? Unemployment Do they work for pay /profit or look for work? Labour force Do they enter and exit the labour market? Labour turnover, life cycle patterns
Illustration: Unemployment rate by sex and age group TOTAL 14 ILO Department of Statistics
3. Characteristics & conditions of their work Tasks & duties in their job - occupations Kind of goods / services produced - industries Employment relationship - status in employment Security and stability contract type, duration Type of employer - institutional sector Type of establishment formal, informal, household Type of place where they work - place of work Hazardousness of their work occupational injuries, illnesses Voice and representation union density, collective agreements Benefits provided -social security coverage, maternity leave 15
Illustration: Occupations with highest concentration of women / men 16 ILO Department of Statistics
4. Contributions & returns for their work Working time Hours worked, working time arrangements Income from employment Wages, salaries, commissions, tips Profits / losses Overtime payments, other regular & irregular payments Social security benefits Contribution to households, community & economy Value of production for own-final use Value of paid and unpaid work to national production & satellite accounts 17
Illustration: time spent on paid and unpaid work 18 ILO Department of Statistics
19 ILO Department of Statistics
Official sources of work statistics Different sources exist, with different purposes Population and housing census Household surveys Labour force surveys (LFS) Household income & expenditure surveys (HIES) Time-use surveys (TUS) Establishment-based censuses & surveys Administrative records 20 ILO Department of Statistics
Improve quality of work statistics Frameworks, concepts, definitions that recognize gender differences Methods that reduce underreporting & misclassification 24 ILO Department of Statistics
New work statistics framework (Resolution I, 19th ICLS, 2013) Replaces previous international statistical standards on Economically active population, employment, unemployment, underemployment (13th ICLS, 1982) To become the reference framework For work and labour market statistics in decades to come Address gender bias in recognition of ALL work (paid and unpaid) Make visible participation patterns & quantify contributions Inform policies targeting different forms of work, paid & unpaid Working conditions, remuneration, social protection, work life balance, social inclusion & cohesion Contribute to post 2015 development agenda Inclusive, sustainable development policies, job growth 25 ILO Department of Statistics
Work 1st international statistical definition (I) Any activity performed by persons of any sex and age to produce goods or provide services for use by others or for own use Para 6,Resol I. (19th ICLS, 2013) Recognizes ALL productive activities as Work Whether formal, informal, legal, illegal Linked to General production boundary Concept for reference purposes Note: WORK Employment 26 ILO Department of Statistics
Work and the SNA Activities Non-productive activities Productive activities Non-market units Government, Non-profit institutions Households producing for own final use Market units Incorporated, unincorporated Self-care Sleeping Learning Own-recreation Begging Services Goods Services Goods Services Included Goods Previous activity scope for employment New concept of Work == productive activities SNA General production boundary production boundary 27 ILO Department of Statistics
Forms of Work (III): 5 distinguished By main intended destination & transaction type Work (i.e. ALL activities to produce goods and services) For own final use (by households) For use by others (i.e. other units) For remuneration (i.e. for pay or profit) Without remuneration Other work activities (e.g. unpaid compulsory work) S Own-use production work Unpaid trainee work Employment (work for pay or profit) Volunteer work Goods Services S G G G Goods S Services SNA labour input 29 ILO Department of Statistics
Usefulness of new framework 1. Multiple activities of women & men 2. Household allocation of labour, contribution to livelihoods 3. Assessment of labour market participation & integration by persons in forms of work other than employment 31 ILO Department of Statistics
Illustration: Participation of WAP in different forms of work (%) 32 ILO Department of Statistics
Illustration: Own use providers of services by sex and activity cluster (%WAP) Most unpaid household services predominantly performed by women, except for household repairs Source: ILO calculations based on national data (LFS-CWIQ, 2010) 34 ILO Department of Statistics
Classifications of the Working Age Population By Labour force status For labour market monitoring Assessed in a short reference period Based on activity principle, 1-hr criterion, priority rule By Main form of work For social analysis As self-declared
New labour force status classification Classify the population into 3 mutually exclusive & exhaustive groups Based on activity principle, priority rule & 1 hour criterion Total population Outside Labour Force Employed (for pay / profit) Unemployed Min. age threshold Labour force Snap-shot picture of labour market activity at a point in time ILO Department of Statistics Focuses on work transacted for pay or profit 36
Changes in terminology -Removing gender bias in language Labour force = Employed + Unemployed (for pay / profit) (without employment + seeking + available) No longer economically / currently active population Outside labour force No longer economically inactive population No longer includes population below minimum age -ALL forms of work are productive & contribute to the economy -Persons outside labour force may be engaged in other forms of work -Children may be engaged in work, including in child labour 39 ILO Department of Statistics
Labour underutilization -New indicators that recognize other barriers to employment Refers to mismatches between labour supply and demand, which translate into an unmet need for employment among the population Para 40,Resol I. (19th ICLS, 2013) 40 ILO Department of Statistics
Labour underutilization Improved labour market monitoring across contexts/groups Working age population Labour force Outside the labour force Employed (for pay/profit) Labour market attachment Unemployed Potential Labour Force -seeking, not available -available, not seeking Time-related underemployed Want employment but not seeking, not available Do not want employment Labour underutilization (unmet need for employment) ILO Department of Statistics 41
LU1-LU4: Composite measures of labour underutilization LU4 42 ILO Department of Statistics
Illustration: Old and new indicators OLD NEW 43 ILO Department of Statistics
Illustration: Willing non-job seekers Percentage of willing non-job seekers among persons outside the labour force (%) Source: Enqu te nationale sur l Emploi, Morocco 2012 44 ILO Department of Statistics
Classification by Main reason for not being in labour market Personal reasons Own illness, disability Studies, training Family related reasons Pregnancy, family or household responsibilities Refusal by family Labour market reasons Past failure in finding a job, gave up looking for jobs Lack of experience, qualifications or jobs matching skills Lack of jobs in the area Considered too young or too old by prospective employers Lack of infrastructure No roads, transport, employment services in the area Other sources of income Pensions, rents Social barriers Discouragement 45 ILO Department of Statistics
Issues in measurement To reduce underreporting & misclassification 46 ILO Department of Statistics
Reduce gender biases in data collection Instrument design Add probes (questions) and examples to better capture activities likely to be underreported (secondary, casual, part/-time self-employment jobs) Use reference periods that take account of different gender roles Field operations Interviewer training (raise awareness of concepts, activities likely to go unreported, social expectations & roles, multiple activities of women) Mixed teams of interviewers (men / women) Avoid proxy responses, reduce interviewer interpretation by providing full questions to be read verbatim Data processing, coding Collect detailed information for industry and occupation Reduce coding based on assumptions of typical gendered occupations 47 ILO Department of Statistics
Suggested activities for gender units and gender focal points Review questionnaires, manuals & training for surveys and censuses: Work topics covered (main topics + causal factors) Use of additional questions on WHY not working, not seeking work etc.) Use of probing questions, activity lists / sketches Examples given in the manuals (should be free of gender bias) Degree of details used in classifications Coverage of gender aspects in the training Discuss data quality with survey/census team Get involved in data quality assessments at the end of data collection Careful assessment of data for adequate interpretation
Facilitate understanding of gender differences Highlight gender issues in presentation of data Often requires detailed disaggregation to identify differences 49 ILO Department of Statistics
Basic table for gender analysis Title Women Men Sex distribution N % N % %W %M A B C Total Source 100 100 50
Group exercise Using the handout provided, do the following: 1. Identify key gender issue(s) 2. Determine key message(s) to be highlighted 3. Propose a title / heading that highlights the gender issue shown 4. Draft a short paragraph explaining key message(s) 5. Discuss its relevance for labour market and social policies 6. Was the information provided sufficient? -If no, which additional information is needed? 51
Resources and Contact ICLS Resolutions and Guidelines Resolution concerning statistics of Work, Employment and labour underutilization (2013) Checklist of good practices for mainstreaming gender in labour statistics (2003) http://www.ilo.org/global/statistics-and databases/standards-and- guidelines/ ILO STATISTICS contact statistics@ilo.org 52 ILO Department of Statistics


")


: 5 distinguished")