Intelligent Data Visualization for Spacecraft System Diagnoses
Explore the development of intelligent data visualization software for cross-checking spacecraft system diagnoses presented at AIAA Infotech@Aerospace 2012. The project aims to enhance diagnostic accuracy and trust in automation through improved visualization techniques.

Download Presentation

Please find below an Image/Link to download the presentation.
The content on the website is provided AS IS for your information and personal use only. It may not be sold, licensed, or shared on other websites without obtaining consent from the author. If you encounter any issues during the download, it is possible that the publisher has removed the file from their server.
You are allowed to download the files provided on this website for personal or commercial use, subject to the condition that they are used lawfully. All files are the property of their respective owners.
The content on the website is provided AS IS for your information and personal use only. It may not be sold, licensed, or shared on other websites without obtaining consent from the author.
E N D
Presentation Transcript
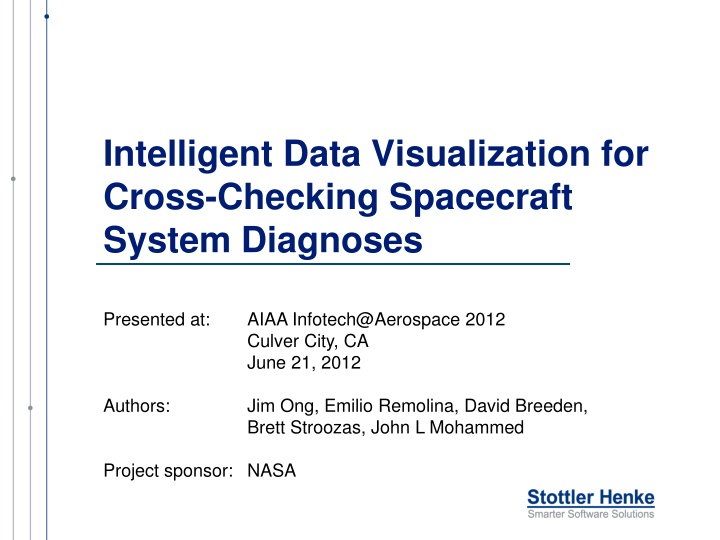
Intelligent Data Visualization for Cross-Checking Spacecraft System Diagnoses Presented at: AIAA Infotech@Aerospace 2012 Culver City, CA June 21, 2012 Authors: Jim Ong, Emilio Remolina, David Breeden, Brett Stroozas, John L Mohammed Project sponsor: NASA
Project Overview Future space missions will require automated system management. Motivation Diagnostic reasoning systems are fallible when problems lie outside its expertise. Cross-checking enables crew to consider alternate diagnoses and analyze evidence. Cross-checking improves diagnostic accuracy and increases trust in automation. Project Goal Develop intelligent data visualization software that helps users cross-check automated diagnostic reasoning systems more quickly and accurately. 2
Test Data: Diagnosis Competition (DxC 09) Commands Sensor data Injected faults Diagnostic Algorithms (DAs) ADAPT Testbed DA Diagnoses Intelliviz 3
Intelliviz Development Process Developed Baseline Data Viz Software Manually Cross-Checked Diagnoses Identified Cross-Checking Strategies and Heuristics Enhanced Analyses and Visualizations Developed Intelligent Diagnostic Assistance 5
DxC: Exp #824 Diagnoses, Symptom Auto Dx = Fan Alt Dx = Relay Alt Dx = Fan Speed Sensor 6
DxC: Cross-Checking Heuristics 1. Prioritize diagnoses and cross-checking 2. Identify symptoms underlying diagnosis 3. Assess plausibility of symptoms 4. Recognize sensor reading signatures. 5. Understand the reasoning behind the original diagnosis. 6. Hypothesize and evaluate alternate diagnoses. 7. Understand the overall pattern of problems and events. 8. Look for abrupt changes 9. Consider earlier events if necessary. 8
DxC: Cross-Checking Heuristics (2) 10. Search for components that might cause a component to misbehave. 11. Search for possible causes that are near the symptoms. 12. Check other sensor data for consistency with candidate fault. 13. When explaining symptoms, consider specific failure modes. 14. Divide and conquer 15. Compare component s behavior with reference values and relationships. 16. Compare component s behavior with a similar component s. 17. Exploit physical constraints. 9
DxC: Interactive Analysis, Visualization Automated Data Change Detection Detect and highlight abrupt changes in value, slope, variation Change in value, slope, variation Filter Data By: Location w/rt selected component (upstream, downstream, sibling, cousin) User-specified distance Color-coded schematic Sensor type: current, voltage, etc. Shows spatial patterns of sensors that satisfy filter criteria 10
Automated Change Detection Sensor selected in schematic Automatically detected changes 11
ADAPT Interactive Schematic Display Color-coding highlights selected components and sensors Sensor selection criteria PM/IDE - Planning Model Integrated Development Environment 12
Intelligent Data Visualization Assistant Context Sensor Data Hypotheses, Data Patterns, Rationale Data Pattern Detection Visualization Spatial-Temporal Data Displays Rationale Display 13
Diagnostic Rules Symptom A Symptom B Diagnosis 1 DA Diagnosis Diagnosis 2 Data Pattern C Data Pattern D Symptom Rules Find data patterns the original Dx might explain Hypothesis Rules Find alternate Dxs that might explain a symptom Find patterns that support or rebut Dxs. Support Rules 14
Example Symptom Rule IF 1. The DA Diagnosis is: a CIRCUIT-BREAKER failed in mode STUCK-CLOSED, and 2. The following data pattern is present: There is a sensor of type CB-POSITION-SENSOR that is linked to the CIRCUIT-BREAKER and There is a data patterns for the sensor variable: EXISTS_VALUE CLOSED and The start time of the sensor data pattern precedes the hypothesis by less than 5 seconds. THEN assume that the DA diagnosis might have been generated to explain this data pattern (symptom). 15
Diagnostic Rationale Matrix PM/IDE - Planning Model Integrated Development Environment 16
ACAWS Eye Movement Data 25 Aug 2010 Intelliviz Visualization of Kepler Mission Data 18
Results . Arrays of graphs and timelines (DataMontage), integrated with spatial data displays, are effective for analyzing complex, spatial-temporal data more effectively. Simple diagnostic reasoning + data visualization accelerates diagnosis and cross-checking by helping users detect, review, and interpret relevant data patterns more quickly. 19
Technologies . DataMontage Modular Java software for visualizing complex, time-oriented data (TRL 9) Intelligent Diagnosis Proof of concept prototype that detects and displays important data patterns to accelerate cross-checking and diagnosis (TRL 6) Cross-checking 20


")


")