Interconnection Networks
Interconnection networks connect processors and memory elements within and across computers, ranging from on-chip networks to wide area networks. Components like network interfaces, switches, and crossbars play crucial roles in data communication. Understanding network architecture, topology, routing, and flow control is essential for efficient data transfer and processing in various computing environments.
Download Presentation

Please find below an Image/Link to download the presentation.
The content on the website is provided AS IS for your information and personal use only. It may not be sold, licensed, or shared on other websites without obtaining consent from the author. If you encounter any issues during the download, it is possible that the publisher has removed the file from their server.
You are allowed to download the files provided on this website for personal or commercial use, subject to the condition that they are used lawfully. All files are the property of their respective owners.
The content on the website is provided AS IS for your information and personal use only. It may not be sold, licensed, or shared on other websites without obtaining consent from the author.
E N D
Presentation Transcript
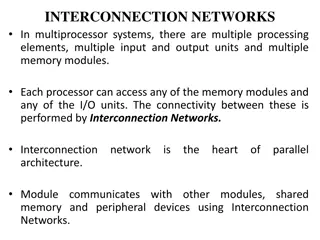
Interconnection Networks Interconnection networks connect processors and memory elements within and across computers. o On-chip network connecting cores o System/Storage area network (clusters, supercomputers, data centers) o Local area network o Wide area network
Interconnection network components Network interface (card) Communication between a node and the network Link Bundle of wires and fibers that carry signals Switches (routers) Connects a fixed number of input channels to a fixed number of output channels. In the HPC community, switches also have the router functions.
Internal of a Switch Input data need to be moved to the output ports asap in a switch. Input and output buffers. The CRS module takes the input information and decides the setting of the cross-bar The cross-bar can realize a communication from any input port to any output port.
Crossbar can realize any permutation from input to output. i n p u t 1 2 3 4 1 2 3 4 1 2 3 4 1 2 3 4 1 2 3 4 1 2 3 4 output (1,2,3,4)-> (4,3,2,1) (1,2, 3, 4)-> (3, 1, 2, 4) A 4x4 cross-bar Permutation: A communication pattern where each source happens once, each destination happens once. For example: (1, 2, 3, 4) -> (3, 1, 2, 4)
Network architecture An interconnect consists of NICs, links, and switches(routers). Network architecture consists of oTopology (what): how to connect the nodes with links? oRouting (which): which path a packet will go through? oSwitching (how): how a packet goes through a path (routers)? oFlow control (when): when can a packet go through a router?
Network topology (what): how the nodes are connected with links?
Switching (how): how a packet goes through a switch Cut-through switching Store and forward switching
What makes network design challenging? Distributed control: network resources are distributed oImpractical to maintain a global network state view Traffic is usually changing and unpredictable Network resources are shared by all. oEach link is not able to support all traffic that may use the link a link can easy become a bottleneck when the control makes wrong choices. Performance metrics: latency and bandwidth o In any situation, the network must do well in these two metrics.
Performance metric: packet latency Packet latency = ???? ??????? + ???????? ????? Under light load, ???????? ????? 0, packet latency = link latency * number of links The network is saturated when the average packet latency approaches -- the queue length on some link keeps increasing until the limit. o Under heavy load, packet latency is mostly queueing delay!
Performance: Network offered load .vs. average package latency Average package latency Offered load (packet generation rate) Packet latency grows very slowly at low loads, but very fast when the network is about to saturate.
Performance: Network offered load .vs. average package latency Minimal latency bounded by topology and routing and flow control Average package latency Minimal latency bounded by topology and routing Minimal latency bounded by topology Offered load (packet generation rate)
Performance: Network offered load .vs. average package latency Max throughput bounded by topology and routing and flow control Average package latency Max throughput bounded by topology and routing Max throughput bounded by topology Offered load (packet generation rate)
Estimating the network performance Given a traffic pattern, we often can estimate the latency under light load and throughput under heavy load. Estimate low load latency: Given the traffic pattern, compute the average hop count. Let the latency for each link be 100ns in the following topology, for the random uniform traffic (for each packet, the source and the dest ination are random uniformly selected from all nodes), what is the lower bound for latency? 2 1 3 4 5
Estimating the network performance Let the latency for each link be 100ns in the following topology, for the random uniform traffic (for each packet, the source and the destination are random uniformly selected from all nodes), what is the lower bound for latency? Hop count for each pair of node n1 n2 n3 n4 n5 n1 - 1 2 3 4 n2 1 - 1 2 3 n3 2 1 - 1 2 n4 3 2 1 - 1 n5 4 3 2 1 - Ave hop count = 1 8+2 6+3 4+4 2 = 2 20 Ave latency = 2 * 100 = 200ns 2 1 3 4 5
Estimating the network performance Let each link have a bandwidth of 1 (transferring 1 packet in 1 cycle of time), for the random uniform traffic (for each packet, the source and the dest ination are random uniformly selected from all nodes), what is the upper bound for aggregate saturated throughput? o The network is saturated when some link cannot handle its traffic. o To find out the saturated throughput, we need to find maximum link load Under uniform traffic, the link used by the most communication (source-destination pair) will have the highest load Which link in the topology will have a higher load then others? 2 1 3 4 5
Estimating the network performance Eight links in the topology (1, 2), (2, 3), (3, 4), (4, 5), (2, 1), (3, 2), (4, 3), (5, 4) (1, 2), (2, 3), (3, 4), (4, 5) and (2, 1), (3, 2), (4, 3), (5, 4) are symmetrical, so we only need to consider (1, 2), (2, 3), (3, 4), (4, 5) to determine the largest link load o (1 , 2) and (4, 5), each is used by 4 communications, (2, 3) and (3, 4), each is used by 6. o Let the maximum per node generation rate be X per cycle. Each cycle 5*X packets are generated. The change for each packet to use link (2, 3) is 6/20. So 5*x * 6/20 <= 1, X<=2/3. o The upper bound of average per node throughput is 2/3. 2 1 3 4 5


