Internal Company Analysis - Strengths, Weaknesses, and Financial Analysis

The internal workings of a company to identify strengths, weaknesses, and growth potential through limited financial analysis. Learn about strategies, resources, and capabilities essential for sustainable growth.

Download Presentation

Please find below an Image/Link to download the presentation.
The content on the website is provided AS IS for your information and personal use only. It may not be sold, licensed, or shared on other websites without obtaining consent from the author.If you encounter any issues during the download, it is possible that the publisher has removed the file from their server.
You are allowed to download the files provided on this website for personal or commercial use, subject to the condition that they are used lawfully. All files are the property of their respective owners.
The content on the website is provided AS IS for your information and personal use only. It may not be sold, licensed, or shared on other websites without obtaining consent from the author.
E N D
Presentation Transcript
C.1.2.2. Internal Company Analysis What goes on inside the company?
Learning Objectives Be able to determine the strengths and weaknesses of the organisation Use models to analyse the internal environment of the organisation Perform a limited financial analysis in order to determine the potential for growth
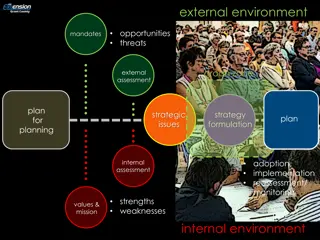
Steps in Developing International Strategies 1. Mission and Objectives 2. External Analysis 3. Internal and Competitive Analysis 4. Strategy Alternatives 5. Strategic Choice, Implementation, Feedback, and Control 4
Content Product Life Cycle Porter s Value Chain Portfolio Analysis BCG Matrix Financial Ratio Analysis Conclusion
RESOURCES Tangible and Intangible CAPABILITIES We Will Look Into 1. Brand, product, product life cycle 2. Market share (position in the BCG Matrix) 3. Value adding activities: Porter s Value Chain Technology People, talent/skills Location Intellectual property (patents) Marketing information/databases/research Partners 4. Financial position
1. Product Life Cycle (Vernon, 1966).
2. Porters Value Chain Porter s Value Chain as explained on Youtube (Porter, 1985).
2. Porters Value Chain - Primary Activities Marketing and Sales Inbound Logistics Operations Outgoing Logistics Service Receiving, storing, and distributing inputs for the product As in processing materials, storage, stock control, arranging transport services, returning goods to suppliers Turning inputs into finished products As in processing, packaging, assembly, maintenance of machines, testing and facilitating operations Gathering and storing the product and physical distribution to buyers As in storage in warehouse, physical control and order processing Provision of resources to enable buyer to buy the product As in advertising, promotion, assignment of quotas, choice of distribution channel, pricing Delivery of service in order to increase the value of the product As in installation, repairs, training, customer relations
2. Porters Value Chain - Secondary Activities Procurement (acquisition) Negotiating, financing, and paying for all inputs across primary and secondary activities Technology Improve the product and production process Human Resource Management Recruiting, hiring, firing, and training employees for the entire value chain Firm Infrastructure General management, planning, financial control, accountancy, governmental issues, legal issues, quality management
2. Porters Value Chain - Analysing The Value Chain Identify the activities which: Have a distinctive economic importance Potentially greatly influence differentiation Represent important or growing proportion of costs Think about how, for each item in the value chain, exceptional value could be created
Class Activity 1: IKEA (15 minutes) Visit the website of IKEA Think of your own experiences when visiting an IKEA store or when consulting an IKEA catalogue According to you, in which of the activities of the value chain is IKEA adding value and can be considered its strength?
3. Portfolio Analysis Boston Consulting Group Portfolio Analysis Matrix Relative Market Share High Low Question Marks Stars High Market Growth Cash Cows Dogs Low Video (Henderson, 1970).
Class Activity 2: Cash Cows (10 minutes) Search the Internet for companies that are marked as cash cows in articles Check if market growth is low and market share is high so that you would indeed classify this product as a cash cow in the BCG Matrix If the information on the Internet is older, try to find more recent information to check if the product is still a cash cow. If not, find the new position. You would expect that the product becomes a dog.
Financial Ratio Analysis Measuring of the financial position of the company using financial indicators or ratios, like: Liquidity Solvency Earning power (profitability)
Indicators to Establish Liquidity Can expenses be paid in the near future? Current ratio Current ratio = current assets : short term loans If value >1 means full coverage of debts, but because some stock might be unmarketable or debtors may be questionable a ratio of 1.5 to 2 is often used Net working capital Net working capital = current assets short term loans A positive value indicates a company can pay of debts A liquidity budget, in which all incoming and outgoing money is opposed for every future period of time, is seen as more reliable predictor than indicators
Indicators to Establish Solvency The proportions of various asset components Solvency ratio: indicator of the degree to which the company is able to meet its obligations Solvency ratio = after tax profits + depreciation : long-term + short-term liabilities In practice a norm between 0.25 and 0.5 is used, depending on the sector of industry. In the case of liquidation of the company, depreciation of the assets of 25% to 50% may occur without jeopardising the total repayment of borrowed funds. Debt ratio: in American business the debt ratio is often used to determine solvency debt ratio = borrowed funds : total assets What is considered a healthy debt ratio depends on the industry
Indicators to Determine Profitability Profitability of total assets Profitability of total assets = (net profit + interest/total assets) x 100% Profitability of equity Profitability of equity = (net profit/equity) x 100% Profit margin Gross profit margin = (profit before interest and taxes/turnover) x 100% Net profit margin = (net profit/turnover) x 100%
Compare Financial Ratios Basis for Comparison Compare each data point individually as well as overall financial condition. 1) company s past, to determine if your financial condition is improving or worsening. Typically, the past three years of performance is sufficient, but if access to older data is available=>spot trends. If, for example, liquidity has decreased consistently, you can make changes. 2) the direct competitors. This can provide an important reality check. Having revenue growth of 10 percent annually may sound good, but if competitors are growing at 25 percent, it highlights underperformance
Financial Ratios in SME Do you want to know more about Financial Ratio s for Small Business? Have a look at the Financial Management for a Small Business training. By: Federal Deposit Insurance Corporation (FDIC) and U.S. Small Business Administration (SBA) Source: SBA. https://www.sba.gov/sites/default/files/files/PARTICIPANT_GUIDE_FINANCIAL_MANAGEMENT.pdf
Homework: Financial Ratio Analysis find an SME that published its financial data. search to determine liquidity (current ratio or net working capital), solvency ratio and debt ratio, profitability of total assets, profitability of equity, and profit margin. write a small paper describing the activities of the SME, some key facts, and the financial ratios. Do you consider the firm to be financial sustainable. Can you recommend that the organisation invests in internationalisation based on the ratios?
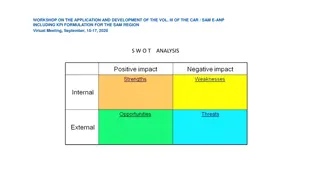
Summary Internal analysis develops understanding of the capabilities of the organisation Internal operations, product portfolio, and financial analysis are common tools If related to external factors, a SWOT and confrontation matrix can be constructed
Learning Objectives Be able to determine the strengths and weaknesses of the organisation Use models to analyse the internal environment of the organisation Perform a limited financial analysis in order to determine the potential for growth
References SBA (n.a.) Financial Management for a Small Business - Participant Guide. https://www.sba.gov/sites/default/files/files/PARTICIPANT_GUIDE_FINANCIAL_M ANAGEMENT.pdf (Retrieved, 15 August 2019) Henderson, B. (1970). The Product Portfolio. BCG Henderson Institute. Online: https://www.bcg.com/publications/1970/strategy-the-product-portfolio.aspx. Porter, M. E. (1985). Competitive advantage: creating and sustaining superior performance. 1985. New York: FreePress. Porter, M. E. (1990). The competitive advantage of nations. Harvard Business Review, March. Porter, M. (2008). The five competitive forces that shape strategy: Harvard Business Review, 86(1), p. 79-93 . Vernon, R. (1966). International Investment and International Trade in the Product Cycle. in: Quarterly Journal of Economics, 2 p. 190 207. 29


")


")