International Dialogue Forum on Low Carbon Development
Findings on poverty reduction, climate change, emissions, and economic growth from key research projects. Understand the dynamics of CO2 emissions in developing countries and the driving forces behind changes in emissions patterns.

Download Presentation

Please find below an Image/Link to download the presentation.
The content on the website is provided AS IS for your information and personal use only. It may not be sold, licensed, or shared on other websites without obtaining consent from the author.If you encounter any issues during the download, it is possible that the publisher has removed the file from their server.
You are allowed to download the files provided on this website for personal or commercial use, subject to the condition that they are used lawfully. All files are the property of their respective owners.
The content on the website is provided AS IS for your information and personal use only. It may not be sold, licensed, or shared on other websites without obtaining consent from the author.
E N D
Presentation Transcript
International Dialogue Forum on Low Carbon Development and Poverty Reduction Indian Statistical Institute, New Delhi, February 21- 22, 2013
Results from a research project on Climate protection, development and equity: Decarbonisation in developing countries and countries in transition Funded by the German Federal Ministry of Education and Research Stephan Klasen (University of G ttingen) Michael Jakob (PIK) Jann Lay (GIGA and University of G ttingen)
Poverty reduction and climate change As income increases
A more direct link: Energy and human development Steckel et al. (forthcoming) Threshold at around 40 GJ per capita 10 GJ per capita can be explained by subsistence needs
Historical contributors to global emissions Since 2000, China has been the main factor behind the increase of global emission Source: Steckel et al. (2011)
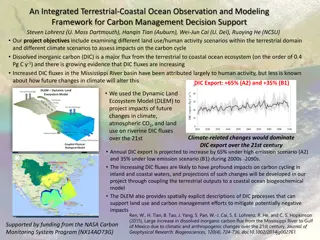
But emission levels still differ In rich countries: Emissions have leveled off and are falling US move to gas, economic crises, high energy prices Europe: Growth of renewables, EUETS, economic crisis Per capita emissions (energy-related CO2) in China approx. 30% in India approx. 80% below German levels
Drivers of CO2emissions in developing countries China Newly Industrializing Countries increase has mainly been driven by economic growth!
Driving forces of changes in emissions CO2emissions per capita GDP per capita Before 2000, growth partially off-set by lower energy intensity After 2000: slow- down or even reversal, and increasing carbon intensity Carbon Intensity Energy intensity
Understanding changes in carbon intensity China World China s increasing carbon intensity almost exclusively due to rising share of coal in the energy system ( renaissance of coal ) Other NICs OECD
Energy use patterns Pronounced differences between OECD and non-OECD countries w.r.t. energy use patterns on the level of primary energy carriers and economic sectors Source: Jakob et al. (2012)
Economic and energy use convergence and economic convergence is closely related to conver-gence of energy use patterns.
Inequality, growth, and emission dynamics Energy use and consumption patterns (lifestyles) differ considerably within countries between income groups Last 20 years have seen high growth and rising inequality in many developing countries (including India), alongside rising emissions Are the rich responsible for rising carbon emissions? Micro level analysis using carbon footprint analyses for India, Indonesia, Philippines Linking household expenditure patterns with input-output tables and emission intensity of production
Micro-level analysis: Indias Carbon Footprint 2004 Income largest driver of carbon footprint Rising middle class will strongly increase emissions (move to carbon-intensive lifestyles) Higher emission due to urbanization and education (over and above income effect) Source: Grunewald et al. 2012
Carbon Footprint in Philippines 2000 2006 5 mean CO2 emission (in tons) Source: Serino (2012) 4 3 2 1 0 1 2 3 4 5 1 2 3 4 5 income quintiles income quintiles cereals & rootcrops fruits & vegetables meat, dairy & egg fish & marine other foods beverages & tobacco hh operation personal care water fuel & light transportation communication clothing & footwear education recreation medical care nondurables durables & equipment repair & maintenance other expenditure
Carbon footprint in Indonesia 2009 Carbon Footprint by Income Group Source: Irfany (2013) 5,000 4,000 2005 Carbon Footprint by Income Group 3,000 3,000 kg CO2 2,000 2,000 kg CO2 1,000 1,000 0 0 1 2 3 4 5 1 2 3 4 5
Remarkably similar patterns in 3 countries Income growth by far the biggest driver of carbon footprint at the household level (elasticity close to 1) Urbanization and education are additional drivers of carbon footprint (but effect weakening over time); Reducing inequality will speed up poverty reduction but will (moderately) increase emissions Does this also hold in a cross-section of countries? Macro level analysis using cross-country data Non-linear effects of income, inequality, and the interaction of the two;
Macro-level analysis Non-linear effect of income growth (Environmental Kuznets Curve, but turning point very high) The higher inequality, the lower aggregate emissions In poor and middle- income countries, this trade-off particularly severe In rich countries less so (and win-win possible) Source: Grunewald et al 2012
How to grow without increasing emissions? Breaking the convergence between economic development and energy use patterns: Renewables as one pathway Trade-offs Often more expensive than fossil fuels Higher energy prices With adverse distributional implications With negative externalities for economic development (industrialization!) Technological challenges (e.g. grid integration) Synergies/win-win situations Green energy systems with positive ancillary (environmental ) benefits Pro-poorness of decentralized energy systems Green jobs? 19
Renewable Energy in Developing Countries (DCs) Hydropower Wide-spread adoption: generated by 83% of all DCs Average share of total electricity: 38 percent (11 percent weighted with total country electricity consumption) Top 3 DC producers (billion kWh in 2009): China (549), Brazil (387), Russia (162), also have top technically exploitable capability Non-hydropower (biomass, geothermal, solar, and wind) Generated by about 45% of DCs Average share of total electricity: 1.4 percent Most important: biomass, geothermal Very uncommon: solar and wind But: High growth rates from low basis Source: Pohl et al. (2012)
Macro analysis of RET adoption Study of diffusion of non-hydro renewable energy technologies for electricity generation (NHRE) across 108 developing countries (between 1980 and 2010) Source: Pohl and Mulder (2013) Main findings: NHRE diffusion accelerates with Implementation of economic and regulatory instruments Higher per capita income and schooling levels Stable, democratic regimes NHRE diffusion is slower with Greater openness and aid Institutional and strategic policy support programs Growth of electricity consumption High fossil fuel production 21
Micro analysis: Solar home systems in Kenya Kenya's SHS market one of the biggest worldwide Data on households from the Kenyan Integrated Household Budget Survey (KIHBS) 2005/06, 13 430 households With information on SHS use and potential drivers Income, education, residence (rural, urban), housing situation Kerosene price Potential grid access, prevalence of SHS Lighting fuel choice model Source: Lay et al. (2012) 22
Main findings Evidence for a cross- sectional energy ladder with very high income threshold for modern fuel use including solar energy use to move beyond traditional and transitional fuel Income, education and SHS clustering are key determinants of SHS adoption 23
Conclusions In the past: Close relationship between economic growth and emissions growth No sign of decoupling in fast-growing developing countries Renaissance of coal Convergence of energy use patterns Inequality of per capita emissions within countries is important: Middle-class effect Very low adoption rates of non-hydro RET, consistent with very late takeoff of SHS at the micro level Decarbonization of economic development in particular the transition is no trivial task
Policy implications Short to medium-term: Reducing emission intensity of production patterns (energy source, use, and systems) Longer-term: Lifestyle and urbanization patterns (but here bigger task is first in industrialized countries) General policy guidelines: (1) Avoid lock-ins, (2) Consider possible synergies and trade-offs If the policy objective are GHG emissions reductions: Think global, seek cooperative solutions Compensation mechanisms, NAMAs Linking of emissions trading schemes Tax/subsidy policies as feasible and effective domestic instrument: Green and progressive tax reforms possible


")