International Tourism's Socio-Economic Impact on EU Countries
The research delves into the significance of international tourism for the EU, analyzing its role in economic growth, job creation, and regional development. With a focus on the impact of factors like digitalization and sustainability, the study aims to provide insights into policies for sustainable growth and resilience in the post-pandemic era.
Download Presentation

Please find below an Image/Link to download the presentation.
The content on the website is provided AS IS for your information and personal use only. It may not be sold, licensed, or shared on other websites without obtaining consent from the author.If you encounter any issues during the download, it is possible that the publisher has removed the file from their server.
You are allowed to download the files provided on this website for personal or commercial use, subject to the condition that they are used lawfully. All files are the property of their respective owners.
The content on the website is provided AS IS for your information and personal use only. It may not be sold, licensed, or shared on other websites without obtaining consent from the author.
E N D
Presentation Transcript
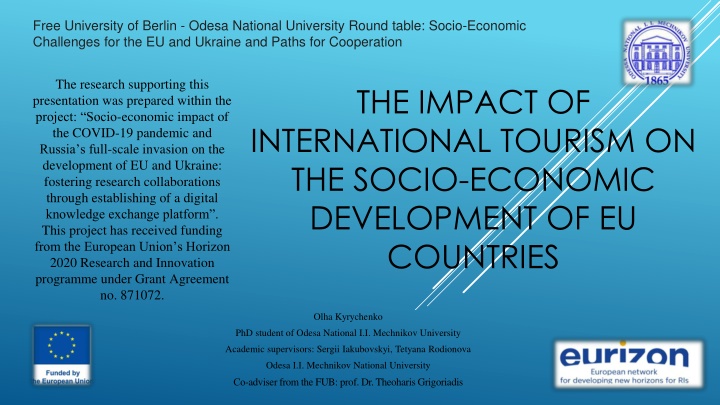
Free University of Berlin - Odesa National University Round table: Socio-Economic Challenges for the EU and Ukraine and Paths for Cooperation The research supporting this presentation was prepared within the project: Socio-economic impact of the COVID-19 pandemic and Russia s full-scale invasion on the development of EU and Ukraine: fostering research collaborations through establishing of a digital knowledge exchange platform . This project has received funding from the European Union s Horizon 2020 Research and Innovation programme under Grant Agreement no. 871072. THE IMPACT OF INTERNATIONAL TOURISM ON THE SOCIO-ECONOMIC DEVELOPMENT OF EU COUNTRIES Olha Kyrychenko PhD student of Odesa National I.I. Mechnikov University Academic supervisors: Sergii Iakubovskyi, Tetyana Rodionova Odesa . . Mechnikov National University -adviser from the FUB: prof. Dr. Theoharis Grigoriadis
ACTUALITY The significance of international tourism in shaping the socio-economic landscapes of EU countries has become increasingly evident, especially in the context of the global challenges and transformations that the sector faces. International tourism serves as a major economic driver for many EU nations, contributing to GDP, job creation, and regional development. The sector not only generates direct revenue from tourist spending but also stimulates growth in interconnected industries, such as transportation, hospitality, constructions and cultural services. With ongoing shifts, such as digital transformation, climate concerns, and post- pandemic recovery, the EU s tourism sector is undergoing significant changes. As countries strive to adapt to these pressures, understanding tourism's socio-economic impact becomes crucial for policymakers, business leaders, and local communities. This research thus addresses a pressing need to assess how tourism contributes to economic resilience and social wellbeing across most developed, in tourism, EU nations and to provide insights into policies that can sustain growth.
Dynamics of international tourism development in EU countries The dynamics of international tourism development in EU countries have shown steady growth over the past decades, with periodic declines, particularly due to the COVID-19 pandemic. Before the pandemic, Europe remained one of the most attractive tourist regions globally, accounting for a significant share of global tourism revenue. After the crisis, the sector began actively recover, adapting to new conditions and trends such as digitalization, sustainable development, and environmental responsibility. In recent years, there has been a gradual return to pre-crisis levels, with an increase in the number of tourists, higher spending, and the emergence of new tourism strategies. The level of tourism development in EU countries varies significantly. For example, Spain, France, and Italy traditionally lead in terms of tourist numbers and revenues, thanks to their rich cultural heritage and popular tourist attractions. At the same time, Eastern European countries, such as Poland, Hungary, and Romania, have been developing tourism more actively in recent years but still have lower tourist flows and revenues.
A comparative analysis of tourist flows and economic growth across all EU countries was conducted, and based on these criteria (tourists spendings, tourist arrivals and GDP per capita), a cluster analysis was performed. This analysis identified four distinct clusters. Austria, the Netherlands, Denmark, Belgium, Sweden, Finland, and Ireland CLUSTERS Bulgaria, Estonia, Lithuania, Slovakia, Latvia, Romania, Cyprus, Malta, Slovenia, the Czech Republic, Hungary, Greece, Poland, and Portugal Luxembourg Germany, France, Italy, Spain, and Croatia
The place of selected EU countries in the ranking of the most visited countries in the world (2019- 2024 (Q3) Country The country's place in the top 30 ranking of the most visited countries in the world and the number of arrivals, million 2019 2020 2021 2022 2023 2024 France 1 1 1 1 1 1 The number of tourist arrivals, million 90,9 41,7 48,4 79,4 100 89,4 Spain 2 5 3 2 2 2 The number of tourist arrivals, million 83,5 18,93 31,2 71,66 85,17 83,7 Italy 5 2 5 5 4 5 The number of tourist arrivals, million 64,5 25,2 26,9 49,81 57,25 64,5 Germany 9 8 9 8 8 9 The number of tourist arrivals, million 39,6 10,9 11,7 28,46 34,8 39,6 - Croatia 27 21 11 16 24 - The number of tourist arrivals, million 17,4 5,5 10,6 15,32 17,4
Comparative analysis of tourist flows and spendings with the economic growth in Germany and France 80,000 70,000 60,000 50,000 40,000 Germany and France are showing positive trends in all key indicators. The number of international tourists and tourist spending are increasing, with some fluctuations due to the pandemic. GDP per capita is also showing significant growth, confirming the countries economic development. 30,000 20,000 10,000 0 1995 1996 1997 1998 1999 2000 2001 2002 2003 2004 2005 2006 2007 2008 2009 2010 2011 2012 2013 2014 2015 2016 2017 2018 2019 2020 2021 2022 2023 Number of tourist arrivals Germany (thousands) Tourist spendings Germany (mln doll USA) GDP per capita Germany, doll 100,000 70000 90,000 60000 80,000 50000 70,000 60,000 40000 Germany and France remain popular tourist destinations and continue to be important economic players in Europe. 50,000 30000 40,000 30,000 20000 20,000 10000 10,000 0 0 1995 1996 1997 1998 1999 2000 2001 2002 2003 2004 2005 2006 2007 2008 2009 2010 2011 2012 2013 2014 2015 2016 2017 2018 2019 2020 2021 2022 2023 Number of tourist arrivals France (thousands) Tourist spendings France (mln doll USA) GDP per capita France, doll
Comparative analysis of tourist flows and spendings with the economic growth in Italy and Spain 70,000 60000 60,000 50000 50,000 40000 40,000 30000 Italy is showing steady growth in all three indicators: international tourist arrivals, tourist spending and GDP per capita. Despite a significant decline in 2020 due to the Covid-19 pandemic, tourism activity and spending have recovered quickly, reaching new records in 2023. GDP per capita also continues to grow steadily, indicating the economic dynamics. 30,000 20000 20,000 10000 10,000 0 0 1995 1996 1997 1998 1999 2000 2001 2002 2003 2004 2005 2006 2007 2008 2009 2010 2011 2012 2013 2014 2015 2016 2017 2018 2019 2020 2021 2022 2023 Number of tourist arrivals Italy (thousands) Tourist spendings Italy (mln doll USA) GDP per capita Italy, doll country's positive Spain is showing positive trends in all three indicators: the number of international tourists, tourist spending and GDP per capita. The Covid-19 pandemic caused a significant decline in tourist numbers and spending in 2020, but the rapid recovery in the following years indicates the stability of the tourism industry and the country's economy. GDP per increasing, confirming the increase in the economic well-being population. 90,000 60000 80,000 50000 70,000 60,000 40000 50,000 30000 40,000 30,000 20000 20,000 10000 10,000 capita is steadily 0 0 of the Spanish Number of tourist arrivals Spain (thousands) Tourist spendings Spain (mln doll USA) GDP per capita Spain, doll
Comparative analysis of tourist flows and spendings with the economic growth in Croatia (1995-2023) Croatia's experienced strong growth over the years, with a strong correlation between the number of international tourists and their spending, reflecting the country's growing popularity destination. tourism sector has 70,000 45000 40000 60,000 35000 as a tourist 50,000 30000 40,000 25000 Croatia's GDP per capita has also shown steady highlighting the country's economic strength and resilience in the face of global challenges. growth, further 20000 30,000 15000 20,000 10000 10,000 5000 0 0 1995 1996 1997 1998 1999 2000 2001 2002 2003 2004 2005 2006 2007 2008 2009 2010 2011 2012 2013 2014 2015 2016 2017 2018 2019 2020 2021 2022 2023 Number of tourist arrivals Chroatia (thousands) Tourist spendings Chroatia (mln doll USA) GDP per capita Chroatia, doll
Comparative analysis of average length of stay in selected countries 6.00 Italy, Spain and Croatia demonstrate a general decline in the average length of stay, suggesting evolving tourist preferences toward shorter trips. France and Germany remained stable with minimal fluctuations. France and Germany have consistently shorter stays, reflecting their urban and business-centric tourism. The pandemic temporarily increased stays in Germany, Croatia and Italy, likely due to travel restrictions leading to fewer but longer trips. 5.00 4.00 3.00 2.00 1.00 0.00 Average length os Stay France (days) Average length os Stay Croatia (days) Average length os Stay Germany (days) Average length os Stay Spain (days) Average length os Stay Italy (days)
Comparative analysis of number of beds in selected countries (1995-2023) France and Croatia have maintained consistent bed numbers, possibly focusing more on quality and capacity utilization rather than expansion. Spain experienced the fastest growth in bed numbers, reflecting its aggressive strategies in expanding tourism infrastructure. While 2020 show a decline in bed numbers in most countries due to the pandemic, recovery was evident by 2022, especially in Germany, Spain, and Italy. 2,500,000 2,000,000 1,500,000 1,000,000 500,000 0 Number of beds France Number of beds Croatia Number of beds Germany Number of beds Spain Number of beds Italy
Regression equations for selected EU countries (1995-2023) Country Equation Croatia Cro.GDPpc= -0.61Cro.Trst+0.791Cro.Exps-0.484Cro.Stay+10.217 France Frn.GDPpc=-0.596Frn.Trst+0.693Frn.Exps+4.131Frn.Beds-48.370 Germany Ger.GDPpc=4.102Ger.Beds+0.846Ger.Stay-49.087 Italy Ita.GDPpc=3,643Ita.Beds+0.991Ita.Stay-43.785 Spain Spa.GDPpc=0.404Spa.Trst-0.181Spa.Exps+0.666Spa.Beds-1.643Spa.Stay-43.339 Note: Trst number of international tourists, Exps international tourist spending, Beds number of beds, Stay average length of stay in the country, GDPpc GDP per capita
MAIN STRATEGIES OF THE SELECTED EU COUNTRIES IN TOURISM INDUSTRY DEVELOPMENT Croatia Development of sustainable tourism: focus on preserving the natural resources of the Adriatic coast and developing ecotourism. Diversification of tourism products: promoting cultural, gastronomic and rural tourism alongside traditional beach tourism. Improvement of infrastructure: investing in upgrading the transport network, especially ports and airports, to increase accessibility of the region. Long tourist season: measures to promote tourism outside the summer season, including festivals, wine tours and active leisure activities. Digital platforms and social media: active use of Instagram, Facebook and YouTube to promote tourist destinations France Preservation of cultural heritage: supporting historical sites and museums such as Versailles and the Louvre to attract cultural tourists. Digitalization of tourism: implementing technologies to simplify bookings, developing apps for tourists. Development of gastronomic tourism: promoting French cuisine as an intangible heritage. Decentralization of tourism: developing regions outside Paris such as the C te d'Azur, Provence, Alsace.
MAIN STRATEGIES OF THE CHOSEN EU COUNTRIES IN TOURISM INDUSTRY DEVELOPMENT Spain Innovation and technology: implementing smart tourism through digital platforms and apps for travelers. Seasonal diversification: focus on winter activities, cultural and sporting events to reduce the pressure on beach areas. Maintaining the ecological balance: developing green tourism and combating mass tourism (overtourism) in cities such as Barcelona. Supporting small businesses: creating conditions for family hotels, restaurants and artisan businesses. Participation in international exhibitions: active presence at major tourism fairs. Italy Promoting cultural tourism: investing in the restoration of historical monuments such as the Colosseum and Pompeii. Gastronomic tourism: developing wine tours and culinary routes. Rural and agrotourism: promoting lesser-known regions such as Umbria and Basilicata to distribute the tourist flow more evenly. Supporting sustainable tourism: initiatives to minimize the impact on nature, including the development of eco- trails and greenways.
MAIN STRATEGIES OF THE CHOSEN EU COUNTRIES IN TOURISM INDUSTRY DEVELOPMENT Germany Cultural and historical tourism: focus on monuments such as Bavarian castles, the Berlin Wall, museums. Business tourism: development of infrastructure for holding international exhibitions and conferences (e.g. in Hanover, Frankfurt, Hamburg). Nature tourism: promotion of active recreation in the Alps and on lakes, cycling. Inclusive tourism: creating facilities for travelers with disabilities. Environmental responsibility: development of eco-friendly hotels and alternative modes of transport, such as electric trains. These strategies allow countries not only to maintain their positions among leading tourist destinations, but also to adapt to global challenges such as climate change and digitalization.
CONCLUSIONS 1. Tourism in the selected EU countries has shown significant growth and resilience, demonstrating the sector's crucial role in driving socio- economic development. 2. In the different studied countries, we observed varying relationships between GDP per capita and tourism indicators. While in some countries, a strong positive correlation was found, where increases in international tourist arrivals and tourism-related expenditures significantly impacted GDP per capita, in others, the connection was less pronounced or influenced by additional factors such as domestic economic policies or infrastructure development. These differences highlight the complex and multifaceted role of tourism in economic development across various nations. 3. To further enhance the sector's sustainability, it is essential to diversify tourism markets, integrate digital technologies, and develop innovative tourism models that respond to emerging global trends.
REFERENCES 1. World from: https://databank.worldbank.org/indicator/NY.GDP.PCAP.CD/1ff4a498/Popular-Indicators Development Indicators | DataBank. Bank. Retrieved DataBank | The World 2. Global tourism industry - statistics & facts. tourism/#topicOverview Retrieved from: https://www.statista.com/topics/962/global- 3. 145 from: https://www.unwto.org/tourism-statistics/key-tourism-statistics key tourism statistics. closer. Retrieved UN Tourism | Bringing the world 4. Statista - The Statistics Portal for Market Data. Retrieved from: https://www.statista.com/topics/3848/travel-and- tourism-in-europe/ 5. Final report. (2021). Regional impacts of the COVID-19 crisis on the tourist sector. 1st edition. Luxembourg: Publications Office of the European Union. doi: 10.2776/179573 6. UNWTO World Tourism Barometer - May 2023. Retrieved from: 1.amazonaws.com/s3fs-public/2023- 05/UNWTO_Barom23_02_May_EXCERPT_final.pdf?VersionId=gGmuSXlwfM1yoemsRrBI9ZJf.Vmc9gYD https://webunwto.s3.eu-west- 7. Most Visited Countries in the World 2024: Statistics. Retrieved from: https://wptravel.io/most- visited-countries-in-the-world/#h-top-10-most-visited-countries-in-the-world-all-time
