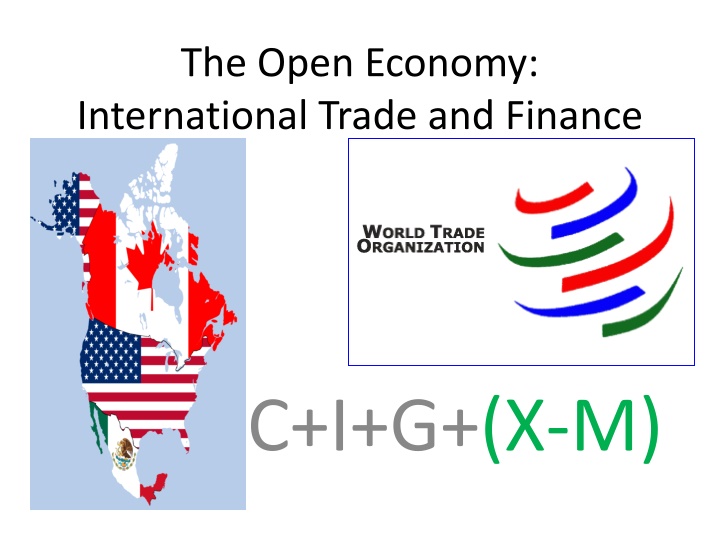
International Trade and Finance in the Open Economy
Explore the dynamics of international trade and finance in the open economy, including trade balances, current account deficits, comparative advantage, and the interaction of the current and capital accounts. Learn about key concepts through practical examples and visuals, and grasp the significance of trade for countries like the USA.

Uploaded on | 2 Views
Download Presentation

Please find below an Image/Link to download the presentation.
The content on the website is provided AS IS for your information and personal use only. It may not be sold, licensed, or shared on other websites without obtaining consent from the author. If you encounter any issues during the download, it is possible that the publisher has removed the file from their server.
You are allowed to download the files provided on this website for personal or commercial use, subject to the condition that they are used lawfully. All files are the property of their respective owners.
The content on the website is provided AS IS for your information and personal use only. It may not be sold, licensed, or shared on other websites without obtaining consent from the author.
E N D
Presentation Transcript
The Open Economy: International Trade and Finance C+I+G+(X-M)
Lets break this down a bit. Try Khan Academy https://www.youtube.com/watch?v=dirBYVjD k7A&list=PLAEA5E9ACA1508F92
Trade Balance American Exports In 2013 $1.579 T In 2014 $2.343 T Machinery: $213,108,199,000 (13.5% of total exports) Electronic equipment: $165,604,449,000 (10.5%) Mineral fuels including oil: $148,426,743,000 (9.4%) Vehicles excluding trains and streetcars: $133,640,479,000 (8.5%) Aircraft and spacecraft: $115,380,944,000 (7.3%) American Imports In 2013 $2.330 T In 2014 $2.851 T Oil $389,300,000,000 (16.7% of total imports) Machinery $311,200,000,000 (13.4%) Electronic Equipment $303,500,000,000 (13%) Vehicles $253,300,000,000 (10.9%) Medical and Technical Equipment $72,100,000,000 (3.1%)
Current Trade Deficit in November 2014 was -$39 B
Comparative Advantage Product Country A Country B Wheat 200 50 TVs 100 50
Current Account page #412 Balance of payments on goods and services plus net international transfer payments and factor income
Capital (Financial) Accounts Measures international sales of financial assets Stocks, securities, savings bonds Capital inflows and outflows
Current Account + Capital Account = 0 If there is a current account deficit (X<M) than capital inflows will be greater then capital outflows The Chinese have to invest those US dollars back in America If there is a current account surplus (X>M) than capital outflows will be greater then capital inflows. (What to do with the foreign currency we hold?)
Why does demand shift? Changes in tastes and preferences Changes in Price Level Changes in Income Changes in Real Interest Rates
Supply and Demand Move Together What happens when Americans want more Japanese goods? Dollar Market Yen Market
Currency Value Appreciation Demand Increases Supply Decreases Foreigners Love American Products Higher Interest Rates in US Higher Foreign Inflation Rates Depreciation Demand Decreases Supply Increases US Cuts taxes Tariffs on American Products FED buys government securities


 Accounts")