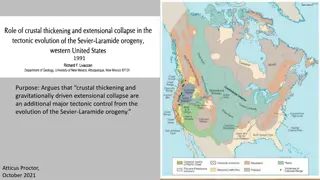
Interpreting Fault Parameters and Block Models in Crustal Deformation
Rooted in plate tectonics theory and continuum models, this study explores the caveats and interpretations of fault parameters and block models in active crustal deformation. Emphasizing the differences between block and continuum models, it delves into the nuances of fault slip rates, block rotation rates, and measures of misfit such as RMS and NRMS. The discussion sheds light on the challenges and considerations inherent in seismic analysis and fault modeling approaches.

Download Presentation

Please find below an Image/Link to download the presentation.
The content on the website is provided AS IS for your information and personal use only. It may not be sold, licensed, or shared on other websites without obtaining consent from the author.If you encounter any issues during the download, it is possible that the publisher has removed the file from their server.
You are allowed to download the files provided on this website for personal or commercial use, subject to the condition that they are used lawfully. All files are the property of their respective owners.
The content on the website is provided AS IS for your information and personal use only. It may not be sold, licensed, or shared on other websites without obtaining consent from the author.
E N D
Presentation Transcript
Caveats and interpretations of fault parameters and block models M. A. Floyd Massachusetts Institute of Technology Modeling Active Crustal Deformation Abastumani, Georgia 28 August 1 September 2015
Dan McKenzie (1972) In a pedantic sense plate tectonics can describe any two- dimensional deformation which can occur, but if the number of independent plates required by such a description becomes large, then plate tectonics ceases to be useful since it is always possible to describe every thrust as a trench and every normal fault as a ridge. If, however, the number of such boundaries required is large it may be more useful to formulate a continuum theory rather than attempt to use plate tectonics in its present form. Caveats and interpretations of fault parameters and block models - M. A. Floyd 2015/09/01 2
Continuum models Relate strain and earthquakes to stresses within deforming regions rather than boundaries between regions that do not deform by Stokes equations of fluid motion Key difference is that: In block models, earthquake slip vectors align with relative plate motions In continuum models, earthquake P (compressive) and T (tensile) strain axes align with principal axes of stress in the medium Block models work well in areas with well-mapped major active faults A continuum approach may be a more reasonable description in areas where faulting is dense and distributed, e.g. NE Turkey and Iran Thatcher (2003) Caveats and interpretations of fault parameters and block models - M. A. Floyd 2015/09/01 3
Things to remember Block models do not estimate fault slip rates They estimate block rotation rates Fault slip rate is the velocity vector due to block rotation projected onto a block boundary ( fault ) Blocks therefore must have a statistically precise estimate of rotation The assumption of an ideal locking depth is assumed in simple calculations Statistics are important for understanding if a model parameter is valid within the uncertainties of the observations Caveats and interpretations of fault parameters and block models - M. A. Floyd 2015/09/01 4
Measures of misfit RMS (root-mean-square residual) WRMS (weighted root-mean-square residual) ?2 (sum of weighted squared residuals) NRMS (normalized root-mean- square) Considered equivalent to square-root of the reduced ?2 , i.e. ?2 per degree of freedom (number of data minus number of free parameters) For a model that fits at the level of uncertainty in the data, this should be 1 = number of data = number of parameters = data point = best-fit model = data uncertainty Residual is difference between data and model at given location in space and/or time = degrees of freedom Caveats and interpretations of fault parameters and block models - M. A. Floyd 2015/09/01 5
tdefnode summary file The quantities on the previous slide are provided in the <model>.sum file, e.g. ?2 ? ? ? ? Modl YYYYMMDDHHMM Misfit DOF Ndata Nparm Prob Variance Data Chi2 Penalty SUM: NAF1 201508300839 4.523 15 18 3 0.000 6.7850E+01 4.5233E+00 0.0000E+00 Indx Code WtFac SigMin SigMax R/S_Max ---Reference Velocity- File name 1 Rei6 1.00 0.00 9999.90 0.00 0.00 0.00 0.00 2005jb004051-ts01.tdfn_gp Name #obs Nrms Wrms Prob SumWt SSData SSfit SSres Chi2/N Filename GPS 18 1.940 1.396 0.0 3.477E+01 5.239E+03 5.174E+03 6.771E+01 3.762E+00 vE 9 2.392 1.766 0.0 1.651E+01 5.101E+03 5.085E+03 5.149E+01 5.721E+00 vN 9 1.342 0.942 6.2 1.826E+01 1.382E+02 8.878E+01 1.622E+01 1.802E+00 Rei6 18 1.940 1.396 0.0 3.477E+01 5.239E+03 5.174E+03 6.771E+01 3.762E+00 2005jb004051-ts01.tdfn_gp vE 9 2.392 1.766 0.0 1.651E+01 5.101E+03 5.085E+03 5.149E+01 5.721E+00 2005jb004051-ts01.tdfn_gp vN 9 1.342 0.942 6.2 1.826E+01 1.382E+02 8.878E+01 1.622E+01 1.802E+00 2005jb004051-ts01.tdfn_gp Eura 6 2.310 1.830 0.0 9.559E+00 8.154E+01 1.794E+02 3.201E+01 5.336E+00 Anat 12 1.725 1.190 0.0 2.521E+01 5.158E+03 4.994E+03 3.570E+01 2.975E+00 P001 6 2.310 1.830 0.0 9.559E+00 8.154E+01 1.794E+02 3.201E+01 5.336E+00 P002 12 1.725 1.190 0.0 2.521E+01 5.158E+03 4.994E+03 3.570E+01 2.975E+00 G001 18 1.940 1.396 0.0 3.477E+01 5.239E+03 5.174E+03 6.771E+01 3.762E+00 Caveats and interpretations of fault parameters and block models - M. A. Floyd 2015/09/01 6
How many faults and blocks? Blocks in models have a tendency to increase with the number of data points Denser and more precise data leads to attempts to estimate more parameters But when is enough enough? Statistical tests can be used to understand whether an additional boundary is necessary given the information provided by the data and associated uncertainties Caveats and interpretations of fault parameters and block models - M. A. Floyd 2015/09/01 7
The F-test Uses Gaussian (normal) statistical distribution to determine if two hypotheses are statistically separable Theoretical F can be calculated if the following are known: Number of data Number of model free parameters Confidence interval (e.g. 95%) Comparison of the theoretical and observed F value provide the test Caveats and interpretations of fault parameters and block models - M. A. Floyd 2015/09/01 8
Nested models Commonly used approach to test whether additional parameters are justified by the data within their uncertainties e.g. model 1 is a subset of model 2 Statistical test proposed by Stein and Gordon (1984) to test additional plate boundaries Caveats and interpretations of fault parameters and block models - M. A. Floyd 2015/09/01 9
An example Model 1 Ndata = 20 (Nsites Ncomponents) Nparams = 6 (3 components of rotation 2 plates) Model 2 Ndata = 20 (Nsites Ncomponents) Nparams = 9 (3 components of rotation 3 plates) Caveats and interpretations of fault parameters and block models - M. A. Floyd 2015/09/01 10
F-test We know ? = 20, ?1 = 6 and ?2 = 9 We run the model and calculate the ?2 misfit We calculate ? from the data We choose a confidence interval (1 ?), e.g. 95% confidence is ? = 0.05 We calculate the theoretical ?crit value If ? > ?crit then the additional plate boundary is statistically significant Caveats and interpretations of fault parameters and block models - M. A. Floyd 2015/09/01 11
What is creep? Creep is an aseismic slip process, which has been observed on many faults including the San Andreas and North Anatolian Faults The presence of creep affects velocity profiles across faults and can affect our model parameters Caveats and interpretations of fault parameters and block models - M. A. Floyd 2015/09/01 12
The influence of creep ( 1) Caveats and interpretations of fault parameters and block models - M. A. Floyd 2015/09/01 13
The influence of creep ( 1) Caveats and interpretations of fault parameters and block models - M. A. Floyd 2015/09/01 14
What is locking depth? Locking depth is ideal notion that faults slip only in earthquakes above a certain depth and creep constantly below that depth It is geophysicists (geodesists and seismologists) simple view of fault structure Don t ask a geologist what they think a fault s locking depth is! This model (mostly) works due to the sparsity of our data, which is confined to the Earth s surface We have very little constraint on the details at depth The reality is that the upper crust is mostly brittle, there is likely a brittle-ductile transition zone, which depends on rheology and temperature, and a ductile zone at depth where deformation may occur in a narrow fault -like zone or across a broad area Both look the same given observations only at the surface Caveats and interpretations of fault parameters and block models - M. A. Floyd 2015/09/01 15
What if our locking depth assumption is incorrect? Caveats and interpretations of fault parameters and block models - M. A. Floyd 2015/09/01 16
Recurrence intervals We might use our results to predict the recurrence interval of earthquakes Using slip rate We must know (e.g. from geological measurements) or assume (e.g. from Wells and Coppersmith relationships between magnitude and slip) ? We might also use moment rate We must assume ?0, e.g. the recurrence time for a Mw7.0 earthquake is years Caveats and interpretations of fault parameters and block models - M. A. Floyd 2015/09/01 17
Complete data is vital Faults don t stop at national or administrative borders Therefore geodetic data must not stop at borders Continued data collection and data exchange is the only way to form as complete a conclusion as possible Otherwise, we are likely to have an incorrect model and interpretation Caveats and interpretations of fault parameters and block models - M. A. Floyd 2015/09/01 18
Summary Fault slip rate is fairly well determined by far-field data Both in 1-D velocity profiles and block model approaches This is a problem when several active faults are close together because separating their relative motions is difficult Locking depth is determined more by near-field data When the assumption of a unique locking depth is violated or creep is present, locking depth is almost always estimated to be shallower than expected Be careful how you interpret locking depth Also beware that other sources of information, such as seismicity at depth, may not help if a fault behaves in a way where the assumption of Savage and Burford (1973) is simply not valid Caveats and interpretations of fault parameters and block models - M. A. Floyd 2015/09/01 19

")


")
")