Interpreting Test Scores: Group A vs. Group B Analysis
Explore the comparison between Group A and Group B test scores in a science test. Discover the mean scores, pass criteria, and analyze why Group B may not necessarily have outperformed Group A based on the provided graph.

Download Presentation

Please find below an Image/Link to download the presentation.
The content on the website is provided AS IS for your information and personal use only. It may not be sold, licensed, or shared on other websites without obtaining consent from the author. If you encounter any issues during the download, it is possible that the publisher has removed the file from their server.
You are allowed to download the files provided on this website for personal or commercial use, subject to the condition that they are used lawfully. All files are the property of their respective owners.
The content on the website is provided AS IS for your information and personal use only. It may not be sold, licensed, or shared on other websites without obtaining consent from the author.
E N D
Presentation Transcript
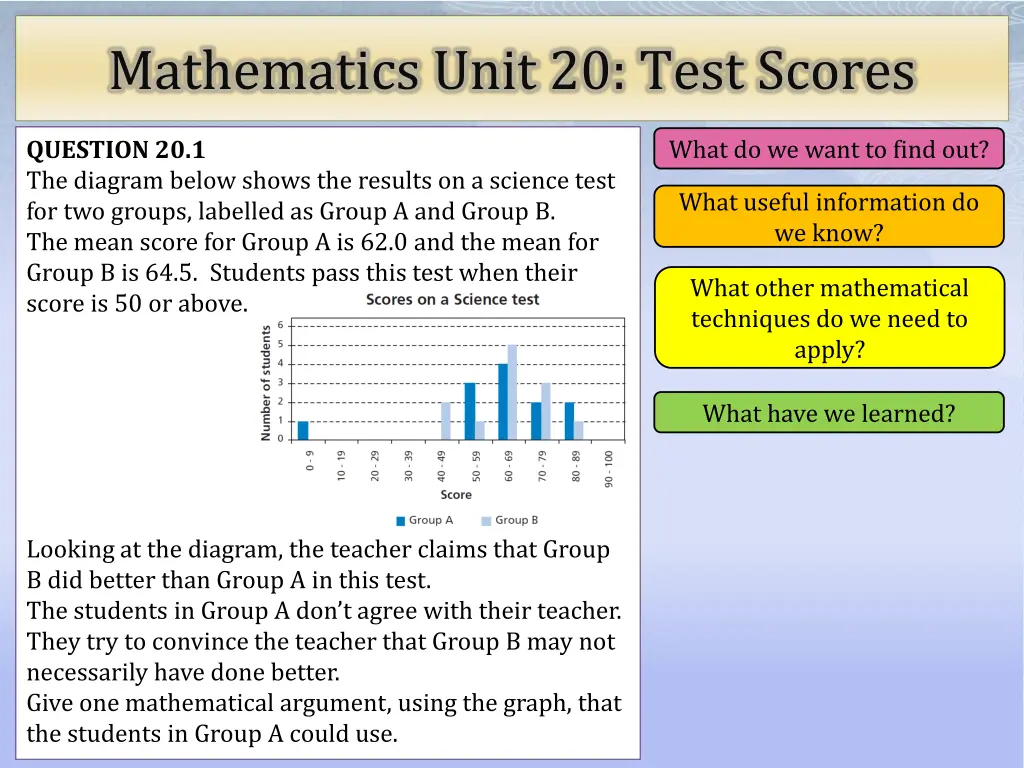
Mathematics Unit 20: Test Scores What do we want to find out? What do we want to find out? QUESTION 20.1 The diagram below shows the results on a science test for two groups, labelled as Group A and Group B. The mean score for Group A is 62.0 and the mean for Group B is 64.5. Students pass this test when their score is 50 or above. What useful information do we know? What useful information do we know? What other mathematical techniques do we need to apply? What other mathematical techniques do we need to apply? What have we learned? What have we learned? Looking at the diagram, the teacher claims that Group B did better than Group A in this test. The students in Group A don t agree with their teacher. They try to convince the teacher that Group B may not necessarily have done better. Give one mathematical argument, using the graph, that the students in Group A could use.
Mathematics Unit 20: Test Scores What do we want to find out? QUESTION 20.1 The diagram below shows the results on a science test for two groups, labelled as Group A and Group B. The mean score for Group A is 62.0 and the mean for Group B is 64.5. Students pass this test when their score is 50 or above. What useful information do we know? What useful information do we know? What other mathematical techniques do we need to apply? What other mathematical techniques do we need to apply? What have we learned? What have we learned? Looking at the diagram, the teacher claims that Group B did better than Group A in this test. The students in Group A don t agree with their teacher. They try to convince the teacher that Group B may not necessarily have done better. Give one mathematical argument, using the graph, that the students in Group A could use. Back to start Back to start
Mathematics Unit 20: Test Scores What do we want to find out? What do we want to find out? QUESTION 20.1 The diagram below shows the results on a science test for two groups, labelled as Group A and Group B. The mean score for Group A is 62.0 and the mean for Group B is 64.5. Students pass this test when their score is 50 or above. What useful information do we know? What other mathematical techniques do we need to apply? What other mathematical techniques do we need to apply? What have we learned? What have we learned? Looking at the diagram, the teacher claims that Group B did better than Group A in this test. The students in Group A don t agree with their teacher. They try to convince the teacher that Group B may not necessarily have done better. Give one mathematical argument, using the graph, that the students in Group A could use. Back to start Back to start
Mathematics Unit 20: Test Scores What do we want to find out? What do we want to find out? QUESTION 20.1 The diagram below shows the results on a science test for two groups, labelled as Group A and Group B. The mean score for Group A is 62.0 and the mean for Group B is 64.5. Students pass this test when their score is 50 or above. What useful information do we know? What useful information do we know? What other mathematical techniques do we need to apply? What have we learned? What have we learned? Looking at the diagram, the teacher claims that Group B did better than Group A in this test. The students in Group A don t agree with their teacher. They try to convince the teacher that Group B may not necessarily have done better. Give one mathematical argument, using the graph, that the students in Group A could use. Back to start Back to start
Mathematics Unit 20: Test Scores What do we want to find out? What do we want to find out? QUESTION 20.1 The diagram below shows the results on a science test for two groups, labelled as Group A and Group B. The mean score for Group A is 62.0 and the mean for Group B is 64.5. Students pass this test when their score is 50 or above. What useful information do we know? What useful information do we know? What other mathematical techniques do we need to apply? What other mathematical techniques do we need to apply? What have we learned? Looking at the diagram, the teacher claims that Group B did better than Group A in this test. The students in Group A don t agree with their teacher. They try to convince the teacher that Group B may not necessarily have done better. Give one mathematical argument, using the graph, that the students in Group A could use. Back to start Back to start