Interruptible Program Impact Evaluation Findings
Explore the impact evaluation findings of an interruptible program for non-residential customers, focusing on load impacts, methodology, program description, and enrollment forecasts. Learn about the emergency demand response program and customer commitments to reduce energy consumption in exchange for capacity credits. Analyze the methodology used to estimate load impacts and understand the weather sensitivity summary regarding program participants. Delve into specific event dates and days of the week affecting load reductions.

Download Presentation

Please find below an Image/Link to download the presentation.
The content on the website is provided AS IS for your information and personal use only. It may not be sold, licensed, or shared on other websites without obtaining consent from the author. If you encounter any issues during the download, it is possible that the publisher has removed the file from their server.
You are allowed to download the files provided on this website for personal or commercial use, subject to the condition that they are used lawfully. All files are the property of their respective owners.
The content on the website is provided AS IS for your information and personal use only. It may not be sold, licensed, or shared on other websites without obtaining consent from the author.
E N D
Presentation Transcript
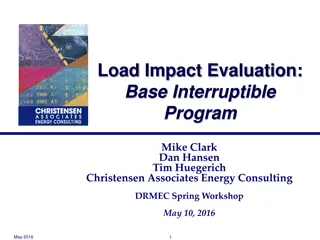
Load Impact Evaluation: Base Interruptible Program Dan Hansen Mike Clark Nick Crowley Christensen Associates Energy Consulting DRMEC Spring Workshop April 26, 2019 April 2019 1
Presentation Outline 1. Program Description 2. Ex-post Methodology 3. Ex-post Load Impacts 4. Ex-ante Methodology 5. Enrollment Forecast 6. Ex-ante Load Impacts April 2019 2
1. BIP Program Description Emergency DR program for non-residential customers, events triggered by CAISO or local system emergencies Customers receive a monthly capacity credit in exchange for a commitment to reduce energy consumption to their Firm Service Level (FSL) The FSL represents the customer s minimal operational requirements 15, 20, or 30-minute notice of events Failure to reduce load to the FSL can result in excess energy charges, an increase in the FSL (and commensurate reduction in capacity credits), re-test events, or de-enrollment from the program April 2019 3
2. Ex-post Methodology Individual regressions were used to estimate BIP ex-post load impacts This method was chosen for two reasons: Difficulty in finding adequate control-group customers Some customers have volatile loads, so even customers that match reasonably well on average may not have a comparable load on a specific day Customer-specific specification search conducted to: Determine whether each customer has a weather-sensitive load Find the best fitting weather and shape variables by groups defined by weather sensitivity and industry group April 2019 4
2. Ex-post Methodology: Weather-sensitivity summary BIP load impacts do not tend change significantly with temperatures because the biggest responders do not have weather-sensitive loads However, there are weather-sensitive customers in BIP that cause the program reference load to change somewhat with temperatures April 2019 5
3. Ex-post Load Impacts: Events Date Day of Week PG&E SCE SDG&E Emergency Event, 10:05-11:59 p.m. (1 subLAP) Emergency Event, 7:45-11:59 p.m. (1 subLAP) 7/18/2018 Wednesday 7/27/2018 Friday Temp. and System Load 12:00-4:00 p.m. 8/9/2018 Thursday Test, 9/26/2018 Wednesday 4:00-10:00 p.m. M&E Event, 3:20-7:00 p.m. 9/27/2018 Thursday April 2019 6
3. Ex-post Load Impacts: Events (2) No. of Available Dispatches 10 / month 1 / day 10 / month 1 / day Hours of Availability Hours of Actual Use No. of Actual Dispatches Utility 180 / year 6 / day 180 / year 6 / day 120 / year 4 / day PG&E 12.1 3 SCE 3.7 1 SDG&E 4 10 / month 1 April 2019 7
3. Ex-post Load Impacts: PG&E September 26th Event Event from 4:00 to 10:00 p.m. 480 enrolled customers Avg. Ref. Load = 338 MW Avg. Load Impact = 249 MW FSL = 75.4 MW % Load Impact = 74% FSL Achievement = 95% Top 10 responders account for 45% of the total load impact April 2019 8
3. Ex-post Load Impacts: SCE September 27th Event Event from 3:20 to 7:00 p.m. 545 enrolled customers Avg. Ref. Load = 815 MW Avg. Load Impact = 643 MW FSL = 90.9 MW % Load Impact = 79% FSL Achievement = 89% Top 10 responders account for 39% of the total load impact Values above represent HE 17- 19, excluding the partial event hour of HE 16 April 2019 9
3. Ex-post Load Impacts: SDG&E August 9th Event Event from 12:00 to 4:00 p.m. 3 enrolled customers Avg. Ref. Load = 1.6 MW Avg. Load Impact = 1.1 MW FSL = 0.34 MW % Load Impact = 73% FSL Achievement = 94% Reference load drops during event hours, so there s little need for customer response by the later event hours April 2019 10
4. Ex-ante Methodology Ex-ante load impacts are based on the most recent full or test / M&E event day, by customer Each customer s ex-ante load impact is set to its ex-post FSL achievement rate: ExPost Achievement = ExPost Load Impact / (Ref. FSL) ExAnte Impact = ExPost Achievement x (Ref. FSL) Load impact is zero if FSL is above the reference load We remove customers who have left BIP Customers who have joined BIP are assigned the program- level FSL achievement rate (applied to their own reference loads and FSL, if available) April 2019 11
4. Ex-ante Methodology (2) Reference loads are simulated using the following: Customer-specific regressions to obtain effect of weather and time- period indicators on usage Ex-ante day types and weather conditions (e.g., August peak month day in a utility-specific 1-in-2 weather year) Load impacts display little to no relationship with weather conditions Biggest responders do not tend to have weather-sensitive loads April 2019 12
5. Enrollment Forecast The table below shows August enrollment in each year of the forecast PG&E forecasts flat enrollment SCE forecasts declining enrollment SDG&E forecasts an increase in enrollment Utility 2019 2020 2021 2022 2023 2024 2025 2026 2027 2028 2029 PG&E SCE 15-min SCE 30-min SDG&E 421 53 439 421 49 431 421 45 423 421 41 415 421 41 415 421 41 415 421 41 415 421 41 415 421 41 415 421 41 415 421 41 415 6 7 8 9 9 9 9 9 9 9 9 April 2019 13
6. Ex-ante Load Impacts: by Year and Weather Scenario Year Weather # SAIDs Load Impact (MW) Temp. ( F) FSL (MW) PG&E 1in2 253.7 93.1 PG&E Aug. All Years 421 69.8 PG&E 1in10 255.4 96.2 Year Weather # SAIDs Load Impact (MW) Temp. ( F) FSL (MW) SCE 1in2 622.8 90.4 Aug. 2019 492 82.3 SCE 1in10 625.9 94.7 SCE SCE 1in2 561.0 90.3 Aug. 2029 456 76.8 SCE 1in10 563.8 94.6 Year Weather # SAIDs Load Impact (MW) Temp. ( F) FSL (MW) SDG&E 1in2 0.9 85.8 Aug. 2019 6 0.5 SDG&E 1in10 0.9 89.0 SDG&E SDG&E 1in2 1.3 85.8 Aug. 2029 9 0.7 SDG&E 1in10 1.3 89.0 April 2019 14
6. Ex-ante Load Impacts: PG&E Ex Post vs. Ex Ante Ex Post / Ex Ante Reference Load (MW) Load Impact (MW) Temp. ( F) FSL (MW) FSL Date / Scenario # SAIDs Achievement Ex Post 9/26/2018 Aug. 2019 Typical Event Day 480 338 249 79 75 95% Ex Ante 421 331 254 93 70 97% The total load impact increases even though enrollment decreases by 59 service accounts Relatively low responders left the program, offset by some joiners and an increase in the load impacts from customers remaining in the program All ex-ante forecasts from this point forward reflect the utility-specific 1-in-2 peak day April 2019 15
6. Ex-ante Load Impacts: SCE Ex Post vs. Ex Ante Ex Post / Ex Ante Reference Load (MW) Load Impact (MW) Temp. ( F) FSL (MW) FSL Date / Scenario # SAIDs Achievement Ex Post 9/27/2018 Aug. 2019 Typical Event Day 545 815 643 82 91 89% Ex Ante 492 795 623 90 82 87% Enrollment drops by a larger percentage than load impacts (10% vs. 3%) because relatively low responders left the program April 2019 16
6. Ex-ante Load Impacts: SDG&E Ex Post vs. Ex Ante Ex Post / Ex Ante Reference Load (MW) Load Impact (MW) Temp. ( F) FSL (MW) FSL Date / Scenario # SAIDs Achievement Ex Post 8/9/2018 Aug. 2019 Typical Event Day 3 1.6 1.1 95.0 0.34 94% Ex Ante 6 1.3 0.9 85.8 0.5 102.9% Differences are primarily due to program load dropping off in the middle of the RA window Ex-post event hours = HE 13 to 16 (12 to 4:00 p.m.) Ex-ante RA window = HE 17 to 21 (4 to 7 p.m.) As a result, there s a lot less load to curtail during the RA window The higher FSL achievement is due to some customer-specific reference loads falling below their FSL April 2019 17
6. Ex-ante Load Impacts: PG&E, Previous vs. Current Aug. 2019 Forecast Aggregate Per-customer When Created # SAIDs Reference Load (MW) Load Impact (MW) FSL (MW) Reference Load (kW) Load Impact (kW) Following PY2017 (Previous) Following PY2018 (Current) 362 309 220.5 75.5 853 609 421 331 253.7 69.8 785 603 The current forecast has more customers The per-customer reference load is slightly lower, but the per-customer load impact is nearly the same April 2019 18
6. Ex-ante Load Impacts: SCE, Previous vs. Current Aug. 2019 Forecast Aggregate Per-customer When Created # SAIDs Reference Load (MW) Load Impact (MW) FSL (MW) Reference Load (kW) Load Impact (kW) Following PY2017 (Previous) Following PY2018 (Current) 550 825 636 105 1,501 1,157 492 795 623 82 1,616 1,266 Note that the previous forecast uses the HE14-18 RA window while the current forecast uses the HE17-21 RA window April 2019 19
6. Ex-ante Load Impacts: SDG&E, Previous vs. Current Aug. 2019 Forecast Aggregate Per-customer When Created # SAIDs Reference Load (MW) Load Impact (MW) FSL (MW) Reference Load (kW) Load Impact (kW) Following PY2017 (Previous) Following PY2018 (Current) 8 2.8 1.5 1.6 345 183 6 1.3 0.9 0.5 220 144 The previous forecast assumed higher enrollment The higher reference load and load impact from the previous evaluation is largely due to the earlier RA window (1 to 6 p.m. vs. 4 to 9 p.m.) April 2019 20
Questions? Contact Dan Hansen, Christensen Associates Energy Consulting Madison, Wisconsin dghansen@CAEnergy.com 608-231-2266 April 2019 21


")