Intersection of Race, Disability, and COVID-19: Machine Learning Insights
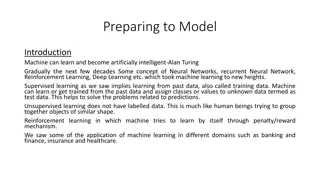
Addressing disparities in COVID-19 outcomes among racial and disabled populations through machine learning analysis at the county level. Utilizing supervised machine learning techniques like Random Forest to predict and classify high and low disparity groups based on various socio-health factors and demographics.

Download Presentation

Please find below an Image/Link to download the presentation.
The content on the website is provided AS IS for your information and personal use only. It may not be sold, licensed, or shared on other websites without obtaining consent from the author.If you encounter any issues during the download, it is possible that the publisher has removed the file from their server.
You are allowed to download the files provided on this website for personal or commercial use, subject to the condition that they are used lawfully. All files are the property of their respective owners.
The content on the website is provided AS IS for your information and personal use only. It may not be sold, licensed, or shared on other websites without obtaining consent from the author.
E N D
Presentation Transcript
The intersection of race, disability, and COVID-19: a machine learning approach Allison Kolbe, Ph.D. Office of the Assistant Secretary for Planning and Evaluation allison.kolbe@hhs.gov Disclaimer: The findings and conclusions in this presentation are those of the author and do not necessarily represent the views of the Office of the Assistant Secretary for Planning and Evaluation or the U.S. Department of Health and Human Services.
Background Racial and ethnic minorities are experiencing higher rates of COVID-19 infection, hospitalization, and death People with disabilities also have a higher risk of infection and death, but relatively little data available How can machine learning be used to fill in these gaps related to COVID-19 risk factors?
Using county-level characteristics to predict disparities in COVID-19 death rates Socio- Healthcare access Physical environment Overall health COVID-19 demographics Income Education Employment Prevalence of chronic conditions Health behaviors Insurance coverage PCPs, ICU beds per capita Pollution Population density Food insecurity/ access Access to COVID-19 testing Local policies Google mobility data
Using county-level characteristics to predict disparities in COVID-19 death rates Socio- Healthcare access Physical environment Overall health COVID-19 demographics Income Education Employment Prevalence of chronic conditions Health behaviors Insurance coverage PCPs, ICU beds per capita Pollution Population density Food insecurity/ access Access to COVID-19 testing Local policies Google mobility data Disparities Disparities (death rates for Black population relative to White population)
Model Details Used supervised machine learning (Random Forest) to classify counties into high and low disparity groups Random Forest can evaluate complex, non-linear relationships between many variables Generally handles correlated variables more robustly than other methods
Model Details Used supervised machine learning (Random Forest) to classify counties into high and low disparity groups Random Forest can evaluate complex, non-linear relationships between many variables Generally handles correlated variables more robustly than other methods Variables 66 county-level numeric descriptors 491 counties that had at least 50 deaths with at least 1% of these in Black individuals (updated 1/26/21)
Model performance (n = 491) Counties with known disparities (225/491) Counties with predicted disparities Model predictions 64% accuracy
Which factors are associated with disparities? Socioeconomic variables Disability Social vulnerability Obesity Self-reported poor health Health ICU beds per 100,000 residents Distance to testing sites Healthcare access COVID-19 related behaviors Change in visits to retail and recreation sites Proportion of people who stayed at home
Which factors are associated with disparities? Socioeconomic variables Socioeconomic variables Disability Disability Social vulnerability Obesity Obesity Self-reported poor health Health ICU beds per 100,000 residents ICU beds per 100,000 residents Distance to testing sites Healthcare access COVID-19 related behaviors Change in visits to retail and recreation sites Proportion of people who stayed at home
Predicting where disparities may be occurring Among counties with > 20 COVID-19 deaths and >1% Black population: Model predicts an additional 725 counties with likely 725 counties with likely disparities disparities
Conclusions Disparities in COVID-19 deaths for Black Americans are driven by many different factors Machine learning is a powerful tool to make predictions where data are limited Improvements in data reporting will be key to help us understand risk factors for COVID-19 deaths in diverse populations
Questions? allison.kolbe@hhs.gov


")