Introduction to Binary Phase Diagrams and Gibbs Free Energy
Mutual solid solubility in binary systems, crystal structure impacts, Gibbs free energy mixing curves, solidus and liquidus compositions, activity-composition relationships, and the effect of temperature on phase diagrams are discussed in this detailed analysis of thermodynamics of materials.

Download Presentation

Please find below an Image/Link to download the presentation.
The content on the website is provided AS IS for your information and personal use only. It may not be sold, licensed, or shared on other websites without obtaining consent from the author.If you encounter any issues during the download, it is possible that the publisher has removed the file from their server.
You are allowed to download the files provided on this website for personal or commercial use, subject to the condition that they are used lawfully. All files are the property of their respective owners.
The content on the website is provided AS IS for your information and personal use only. It may not be sold, licensed, or shared on other websites without obtaining consent from the author.
E N D
Presentation Transcript
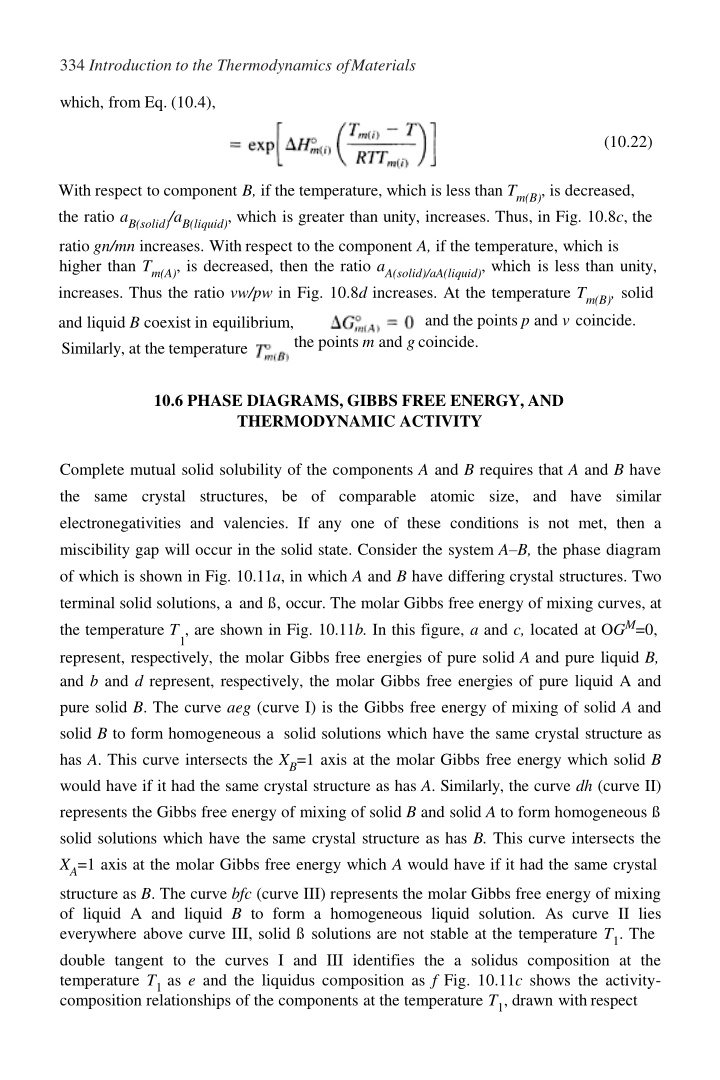
334 Introduction to the Thermodynamics ofMaterials which, from Eq. (10.4), (10.22) With respect to component B, if the temperature, which is less than Tm(B), is decreased, the ratio aB(solid)/aB(liquid), which is greater than unity, increases. Thus, in Fig. 10.8c, the ratio gn/mn increases. With respect to the component A, if the temperature, which is higher than Tm(A), is decreased, then the ratio aA(solid)/aA(liquid), which is less than unity, increases. Thus the ratio vw/pw in Fig. 10.8d increases. At the temperature Tm(B), solid and the points p and v coincide. and liquid B coexist in equilibrium, Similarly, at the temperature the points m and gcoincide. 10.6 PHASE DIAGRAMS, GIBBS FREE ENERGY, AND THERMODYNAMIC ACTIVITY Complete mutual solid solubility of the components A and B requires that A and B have the same crystal structures, be of comparable atomic size, and have similar electronegativities and valencies. If any one of these conditions is not met, then a miscibility gap will occur in the solid state. Consider the system A B, the phase diagram of which is shown in Fig. 10.11a, in which A and B have differing crystal structures. Two terminal solid solutions, a and , occur. The molar Gibbs free energy of mixing curves, at the temperature T , are shown in Fig. 10.11b. In this figure, a and c, located at OGM=0, 1 represent, respectively, the molar Gibbs free energies of pure solid A and pure liquid B, and b and d represent, respectively, the molar Gibbs free energies of pure liquid A and pure solid B. The curve aeg (curve I) is the Gibbs free energy of mixing of solid A and solid B to form homogeneous a solid solutions which have the same crystal structure as has A. This curve intersects the XB=1 axis at the molar Gibbs free energy which solid B would have if it had the same crystal structure as has A. Similarly, the curve dh (curve II) represents the Gibbs free energy of mixing of solid B and solid A to form homogeneous solid solutions which have the same crystal structure as has B. This curve intersects the XA=1 axis at the molar Gibbs free energy which A would have if it had the same crystal structure as B. The curve bfc (curve III) represents the molar Gibbs free energy of mixing of liquid A and liquid B to form a homogeneous liquid solution. As curve II lies everywhere above curve III, solid solutions are not stable at the temperature T1. The double tangent to the curves I and III identifies the a solidus composition at the temperature T1as e and the liquidus composition as f Fig. 10.11c shows the activity- composition relationships of the components at the temperature T1, drawn withrespect
Gibbs Free Energy Composition and Phase Diagrams of Binary Systems 335 to solid as the standard state for A and liquid as the standard state for B. These relationships are drawn in accordance with the assumption that the liquid solutions exhibit Raoultian ideality and the solid solutions show positive deviations from Raoult s law. As the temperature decreases below T1the length of ab increases and the length of cd decreases until, at T=T , the points c and d coincide at OGM=0. At T < T c (liquid B) lies above d in Fig. 10.12b, and, as curve II lies partially below curve III, two double tangents can be drawn: one to the curves I and III, which defines the compositions of the solidus a and its conjugate liquidus, and one to the curves II and III, which defines the compositions of the solidus and its conjugate liquidus. The activity-composition curves at T2are shown in Fig. 10.11c, in which the solid is the standard state for both components. ) the point 2 m(B) m(B Figures 10.11 10.14 The effect of temperature on the molar Gibbs free energies of mixing and the activities of the components of the system A B.
336 Introduction to the Thermodynamics ofMaterials With further decrease in temperature the two liquidus compositions, m and n in Fig. 10.12b, approach one another and, at the unique temperature, TE, the eutectic temperature, they coincide, which means that the two double tangents merge to formthe triple tangent to the three curves shown in Fig. 10.13b At compositions between o and p in Fig. 10.13b a doubly saturated eutectic liquid coexists in equilibrium with a and solid solutions. From the Gibbs phase rule discussed in Sec. 7.6, this three-phase equilibrium has one degree of freedom, which is used to specify the pressure of the system. Thus, at the specified pressure, the three-phase equilibrium is invariant. Fig. 10.13c shows the activities of A and B at TE. At T3<TEcurve III lies above the double tangent to curves I and II, and thus the liquid phase is not stable.This behavior andthe correspondingactivity-composition relationshipsare shown, respectively, inFigs. 10.14band c.
Gibbs Free Energy Composition and Phase Diagrams of Binary Systems 337 If the ranges of solid solubility in the a and phases are immeasurably small, then, as a reasonable approximation, it can be said that A and B are insoluble in one another in the solid state. The phase diagram for such a system is shown in Fig. 10.15a. As all Gibbs free energy of mixing curves have vertical tangents at their extremities, any pure substance presents an infinite chemical sink to any other substance, or conversely, it is impossible to obtain an absolutely pure substance. As the range of solid solubility in Fig. 10.15a is so small that it may be neglected on the scale of Fig. 10.15a, then also the Gibbs free energy curves for formation of a and (curves I and II in Figs. 10.11 10.14) are so compressed toward the XA=1 and XB=1 axes, respectively, that on the scale of Figs. 10.11 10.14, they coincide with the vertical axes. The sequence in Fig. 10.16 shows how, as the solubility of B in a decreases, the Gibbs free energy curve for a is compressed against the XA=1 axis. The Gibbs free energy of formation of the liquid solutions in the system A B at the temperature T is shown in Fig. 10.15b. The double tangent to the a solid solution and liquid solution curves is reduced to a tangent drawn from the point
338 Introduction to the Thermodynamics ofMaterials Figure 10.15 The molar Gibbs free energy of mixing and the activities in a binary eutectic system that exhibits complete liquid miscibility and vitually complete solid immiscibility.
Gibbs Free Energy Composition and Phase Diagrams of Binary Systems 339 Figure 10.16 The effect of decreasing solid solubility on the molar Gibbs free energy of mixing curve. on the XA=1 axis which represents pure solid A to the liquid solutions curve. The corresponding activity-composition relations are shown in Fig. 10.15c. Again these are drawn in accordance with the supposition the the liquid solutions are ideal. In Fig. 10.15c pqr is the activity of A with respect to pure solid A at p, s is the activity of pure liquid A with respect to solid A at p, str is the activity of A with respect to liquid A having unit ac- tivity at s, and Auvw is the activity of B with respect to liquid B having unit activity at w. In a binary system which exhibits complete miscibility in the liquid state and virtually complete immiscibility in the solid state, e.g., Fig. 10.15a, the variations of the activities of the components of the liquid solutions can be obtained from consideration of the liquidus curves. At any temperature T (Fig. 10.15a), the system with a composition between pure A and the liquidus composition exists as virtually pure solid A in equilibrium with a liquid solution of the liquidus composition. Thus, at T in which aA is with respect to liquid A as the standard state. Thus (10.23) or, if the liquid solutions are Raoultian, (10.24) It can be noted that Eq. (10.24) is simply Eq. (10.17) with XA(s)=1.
340 Introduction to the Thermodynamics ofMaterials Consider the application of Eq. (10.24) to calculation of the liquidus lines in a binary eutectic system. In the system Cd-Bi, the phase diagram for which is shown in Fig. 10.17, cadmium is virtually insoluble in solid bismuth, and the maximum solubility of bismuth in solid cadmium is 2.75 mole percent at the eutectic temperature of 419 K. If the liquidus solutions are ideal, the Bi liquidus is obtained from Eq. (10.24) as Figure 10.17 The phase diagram for the system Bi Cd. The full lines are the measured liquidus lines, and the broken lines are calculated assuming no solid solution and ideal mixing in the liquid solutions. The molar constant pressure heat capacities of solid and liquid bismuth vary with temperature as
Gibbs Free Energy Composition and Phase Diagrams of Binary Systems 341 Thus and or This equation is drawn as the broken line (i) in Fig. 10.17. Similarly, if the small solid solubility of Bi in Cd is ignored, at Tm,CD=594 K and thus at 594 K. The constant pressure molar heat capacitiesare and Thus
342 Introduction to the Thermodynamics ofMaterials or which is drawn as the broken line (ii) in Fig. 10.17. Lines (i) and (ii) intersect at the composition of the Raoultian liquid which is simultaneously saturated with Cd and Bi and at 406 K, which would be the eutectic temperature if the liquids were ideal. The actual liquidus lines lie above those calculated, and the actual eutectic temperature is 419 K. From Eq. (10.25), from Eq. (10.23), in the actual eutectic melt, , and from Eq. (10.26), Thus, and The actual eutectic composition is XCd=0.55, XBi=0.45, and thus the activity co-efficients are and Thus, positive deviations from Raoultian ideality cause an increase in the liquidus temperatures. It is now of interest to examine what happens to the liquidus line as the magnitude of the positive deviation from Raoultian behavior in the liquids increases, i.e., as Gxs becomes increasingly positive. Assuming regular solution behavior, Eq. (10.23), written in the form
Gibbs Free Energy Composition and Phase Diagrams of Binary Systems 343 becomes or, from Eq. (9.90), (10.27) Consider a hypothetical system A B in which Thus, for this system where XAis the composition of the A liquidus at the temperature T. The A liquidus lines, drawn for fi=0, 10, 20, 25.3, 30, 40, and 50 kJ, are shown in Fig. 10.18. As fi exceeds some critical value (which is 25.3 kJ in this case), the form of the liquidus line changes from a monotonic decrease in liquidus temperature with decreasing XAto a form which contains a maximum and a minimum. At the critical value of fi the maximum and minimum coincide at XA=0.5 to produce a horizontal inflexion in the liquidus curve. It is apparent that, when fi exceeds the critical value, isothermal tie-lines cannot be drawn between pure solid A and all points on the liquidus lines, which, necessarily, means that the calculated liquidus lines are impossible. From Eq. (10.21) Thus or (10.28)
344 Introduction to the Thermodynamics ofMaterials Figure 10.18 Calculated liquidus lines assuming regular solution behavior in the liquid solutions and no solid solubility. and also (10.29) In Eqs. (10.2) and (10.3) it was seen that imminent immiscibility. Thus in Eqs. (10.28) and (10.29), the state of imminent immiscibility. In Fig. 10.18, ficr=25.3 kJ and the horizontal inflexion in the critical liquidus curve occurs at XA=0.5, T=1413 K. Thus from Eq. (9.90) at the stateof at
Gibbs Free Energy Composition and Phase Diagrams of Binary Systems 345 which is in accord with Eq. (10.1). The phase equilibria generated when fi>ficrare shown in Fig. 10.19 which shows the immiscibility in regular liquid solutions with fi=30,000 J and the A-liquidus for fi=30,000 J shown in Fig. 10.18. The liquid immiscibility curve and the A-liquidus curve intersect at 1620 K to produce a three-phase monotectic equilibriumbetween A and liquidus L1and L2. The liquid immiscibility curve is metastable at temperatures less than 1620 K, and the calculated A-liquidus is physically impossible between the compositions of L1and L2at 1620 K. Figure 10.19 The monotectic equilibrium in a binary system in which the liquid solutions exhibit regular solution behavior with fi=30,000 J. 10.7 THE PHASE DIAGRAMS OF BINARY SYSTEMS THATEXHIBIT REGULAR SOLUTION BEHAVIOR IN THE LIQUID AND SOLID STATES Consider the binary system A B which forms regular liquid solutions and regular solid solutions. The melting temperatures of A and B are, respectively, 800 and 1200 K, and the molar Gibbs free energies of melting are
346 Introduction to the Thermodynamics ofMaterials Consider the system in which fil= 20,000 J in the liquid solutions and fis=0 in the solid solutions. The Gibbs free energy of mixing curves at 1000 K are shown in Fig. 10.20a. As Tm,(A)<1000 K<Tm,(B), liquid is chosen as the standard state for A, and solid is chosen as the standard state for B. With reference to these standard states, the Gibbs free energies of mixing are Figure 10.20 The Gibbs free energy of mixing curves at various temperatures, and the phase diagram for a binary system which forms regular solid solutions in which fis=0 and regular liquid solutions in which fil= 20,000J.
Gibbs Free Energy Composition and Phase Diagrams of Binary Systems 347 for the liquid solutions and for the solid solutions. Inserting the numerical datagives and The double tangent to the curves in Fig. 10.20a gives the liquidus composition of XB=0.82 and the solidus composition of XB=0.97. Decreasing the temperature causes the Gibbs free energies of the liquids to increase relative to those of the solids. As shown in Fig. 10.20b, the Gibbs free energies of pure solid A and pure liquid B are equal at the melting temperature of A, and the double tangent gives liquidus and solidus compositions of XB=0.69 and XB=0.94, respectively. At temperatures lower than Tm, (A)and Tm, (B)solid is chosen as the standard state for both components and the Gibbs free energies of mixing are written as and The curves at 600 K, shown in Fig. 10.20c, contain two double tangents and, as the temperature is further decreased, the curve for the liquids is raised relative to the curve for the solids until, at 480 K, the two double tangents collapse to a single point of contact between the curves at XB=0.41. At temperatures less than 480 K the curve for the liquids lies above that for the solids, and thus solid solutions are stable over the entire range of composition. The variations, with temperature, of the compositions of the double tangents give the phase diagram shown in Fig. 10.20f.
348 Introduction to the Thermodynamics ofMaterials The behavior of the system in which fil= 2000 J and fis=10,000 J is shown in Fig. 10.21. As seen in Figs. 10.21a c, the behavior is similar to that shown in Fig. 10.20. However, with a positive value of fis, a critical temperature exists below which immiscibility occurs in the solid state. With fis=10,000 J, the critical temperature is 10,000/8.3144R=601 K, and the mixing curves at 601 K are shown in Fig. 10.21d. The phase diagram is shown in Fig. 10.21 . With increasingly negative values of filand increasingly positive values of fisthe temperature of the point of contact of the liquidus curve with the solidus curve decreases and the critical temperature in the solid state increases, which eventually produces a eutectic system. The behavior of a system in which fil=20,000 J and fis=30,000 J is shown in Fig. 10.22. The critical temperatures for the liquid and solid solutions are, respectively,
Gibbs Free Energy Composition and Phase Diagrams of Binary Systems 349 Figure 10.21 The Gibbs free energy of mixing curves at various temperatures, and the phase diagram for a binary system which forms regular solid solutions in which fis=10,000 J and regular liquid solutions in which fil= 2000 J.
350 Introduction to the Thermodynamics ofMaterials Figure 10.22 The Gibbs free energy of mixing curves at various temperatures, and the phase diagram for a binary system which forms regular solid solutions in which fis=30,000 J and regular liquid solutions in which fil=20,000 J.
Gibbs Free Energy Composition and Phase Diagrams of Binary Systems 351 1203 and 1804 K, and the Gibbs free energy of mixing curves at 1203 K are shown in Fig. 10.22a. At T 1203 K homogeneous liquids are the stable state, and at temperatures lower than 1203 K immiscibility occurs in the liquid state. The curves shown in Fig. 10.22b at 1150 K contain two double tangents, one joining the conjugate liquid solutions L1and L2and one connecting the liquidus L2with the solidus a . With decreasing temperature the compositions of the conjugate liquid L2and the liquidus L2 approach one another until, at 1090 K, the two double tangents merge to form a triple tangent to liquid compositions at XB=0.23 and 0.77 and a at XB=0.98. This is a monotectic equilibrium. Further cooling produces a single double tangent between L1and a , as shown in Fig. 10.22c, and at 789 K another triple tangent occurs between a at XB=0.01, L1at XB=0.03 and a =0.99. At temperatures lower than the eutectic temperature of 789 K the liquid phase is not stable, and, depending on its composition, the system exists as a, a+a , or a . The monotectic and eutectic equilibria are shown in the phase diagram in Fig. 10.22f. The influence of systematic changes in the values of fil and fis on the phase relationships which occur in the binary system A B which forms regular solid and liquid solutions is shown in Fig. 10.23.* In moving from the bottom of any column to the top, the value of fisbecomes more positive at constant fil, and in moving from left to right along any row the value of fil becomes more positive at constant fis. In the sequence Figs. 10.23a e, the liquid solutions become increasing less stable relative to the solid phases with the consequence that the eutectic temperature is increased and, in the transition from Fig. 10.23d e, the A-liquidus becomes unstable and a monotectic equilibrium occurs. Similarly in the sequence Fig. 10.23h i the temperature at which the three-phase equilibrium occurs is increased from 633 to 799 K with the consequence that the eutectic equilibrium in Fig. 10.23h becomes a peritectic equilibrium in Fig. 10.23i, and in Fig. 10.23j the immiscibility in the solid state disappears at a temperature below that at which a peritectic equilibrium could occur. Also, with fil=20 kJ in Fig. 10.23j, liquid immiscibility occurs at temperatures lower than 20,000/(2 8.3144)=1202 K, and hence a monotectic equilibrium occurs at 1190 K. In Fig. 10.23k the three-phase L1-L2-a equilibrium occurs at 1360 K, which, being higher than Tm,(B), produces asyntectic equilibrium in which the composition of the a phase lies between the compositions of the two liquids. In the sequence Figs. 10.23 (p l f) the solid phase becomes increasingly less stable than the liquid phase, which deepens the depression of the liquidus and solidus curves and eventually forms a eutectic. Figs. 10.20 and 10.22, respectively, show the Gibbs free energy relations in Figs. 10.23p and e, and Fig. 10.21 shows the phase equilibria occurring between those in Fig. 10.23l and those in Fig. 10.23f. *A.D.Pelton and W.T.Thompson, Prog. Solid State Chem. (1975), vol. 10, part 3, p. 119.
352 Introduction to the Thermodynamics ofMaterials Figure 10.23 Topological changes in the phase diagram for a system A B with regular solid and liquid solutions, brought about by systematic changes in the values of fisand fil. The melting temperatures of A and B are, respectively, 800 and 1200 K, and the molar entropies of melting of both components are 10 J/K. (From A.D.Pelton and W.T.Thompson, Prog. Solid State Chem. (1975), vol. 10, part 3, p. 119). 10.8 SUMMARY 1. The molar Gibbs free energy of formation of binary solution A B is given by 2. For a regularsolution,
Gibbs Free Energy Composition and Phase Diagrams of Binary Systems 353 3. The criteria for equilibrium between the phases a and in the binary system A Bare 4. Immiscibility becomes imminent in a regular solution at the critical value of a=2. The critical temperature, below which immiscibility occurs in a regular system, is given by Tcr=2/2R. 5. In a binary system A B which forms ideal liquid solutions and ideal solid solutions, the solidus is given by and the liquidus line is givenby 6. In a binary system A B which contains a eutectic equilibrium and in which the extent of solid solution is negligibly small, the liquidus lines are determined by the conditions 7. Thus, if the liquid solutions are ideal, the A-liquidus compositions are given by and if the liquid solutions are regular, the A-liquidus compositions are given by
354 Introduction to the Thermodynamics ofMaterials 10.9 NUMERICALEXAMPLE The phase diagram for the system Cs-Rb is shown in Fig. 10.24. Examine the extent to which the phase diagram can be reproduced assuming that the liquid solutions are ideal and that the solid solutions are regular. For Cs and for Rb Figure 10.24 The phase diagram for the system Cs-Rb. Initially, draw the Gibbs free energy of mixing curves for the solid and liquid solutions at 9.7 C (282.7 K) and determine if some value of fi gives Gibbs free energy of mixing curves similar to those shown in Fig. 10.21c, i.e., the curve for the liquid solutions lies above the curve for the solid solutions except at a single composition at which the two curves touch one another. Relative to the pure solids as standard states at the temperature T, (i)
Gibbs Free Energy Composition and Phase Diagrams of Binary Systems 355 which, at 282.7 K, becomes Also, (ii) which at 282.7 K becomes The Gibbs free energy of mixing curves, drawn with fi=668 J, are shown in Fig. 10.25, which shows that the curves touch one another at XRb=0.47, in exact agreement with Fig. 10.24. Figure 10.25 The molar Gibbs free energy of mixing curves for ideal liquid solutions and regular solid solutions (with fi=668 J) at 282.7 K, drawn using the Gibbs free energies of melting of Cs and Rb. The Gibbs free energies of mixing, given by Eqs. (i) and (ii), with fi=668 J and T=20 C, 292 K, are shown in Fig. 10.26. The double tangent at the Cs-rich side of the diagram gives the solidus composition as XRb=0.10 and the liquidus composition as XRb=0.13,
356 Introduction to the Thermodynamics ofMaterials which is in excellent agreement with the phase diagram. At the Rb-rich side of the diagram the double tangent gives the solidus and liquidus compositions as, respectively, XRb=0.81, and XRb=0.75, which are in good agreement with the phase diagram values of 0.80 and 0.77. It is thus seen that the phase diagram is reproduced by assuming that the liquid solutions are ideal and the solid solutions are regular with fi=668 J. PROBLEMS 10.1 CaF2and MgF2are mutually insoluble in the solid state and form a simple binary eutectic system. Calculate the composition and temperature of the eutectic melt assuming that the liquid solutions are Raoultian. The actual eutectic occurs at and T=1243 K. Figure 10.26 The molar Gibbs free energy of mixing curves for ideal liquid solutions and regular solid solutions (with fi=668 J) at 293 K, drawn using the Gibbs free energies of melting of Cs and Rb. 10.2 Gold and silicon are mutually insoluble in the solid state and form a eutectic system with a eutectic temperature of 636 K and a eutectic composition of XSi=0.186. Calculate the Gibbs free energy of the eutectic melt relative to (a) unmixed liquid Au and liquid Si, and (b) unmixed solid Au and solid Si.
Gibbs Free Energy Composition and Phase Diagrams of Binary Systems 357 3. Al2O3, which melts at 2324 K, and Cr2O3, which melts at 2538 K form complete ranges of solid and liquid solutions. Assuming that the solid and liquid solutions in the system Al2O3 Cr2O3behave ideally,calculate , and that a. The temperature at which equilibrium melting begins when an alloyof is heated b. The composition of the melt which first forms c. The temperature at which equilibrium melting is complete d. The composition of last-formed solid 4. Na2O B2O3and K2O B2O3form complete ranges of solid and liquid solutions and the solidus and liquidus show a common minimum at the equimolar composition and T=1123 K. Calculate the molar Gibbs free energy of formation of the equimolar solid solution from solid Na2O B2O3at 1123 K, assuming that the liquid solutions areideal. 5. SiO2, which melts at 1723 C, and TiO2, which melts at 1842 C, are immiscible in the solid state, and the SiO2 TiO2binary system contains a monotectic equilibrium at 1794 C, at which temperature virtually pure TiO2is in equilibrium with two liquids containing mole fractions of SiO2of 0.04 and 0.76. If, for the purpose of simple calculation, it is assumed that the compositions of the two liquids are and and that the liquid solutions are regular in their behavior, what is the value of filand at what temperature does the liquid immiscibility gap disappear? 6. The binary system Ge-Si contains complete solid and liquid solutions. The melting temperatures are Tm,Si=1685 K and Tm,Ge=1210 K, and 1200 C the liquidus and solidus compositions are, respectively, XSi=0.32 and = 50,200 J. At XSi=0.665. Calculate the value of assuming a. That the liquid solutions areideal. b. That the solid solutions areideal. Which assumption gives the better estimate? The actual value of 36,900 J. at Tm,Geis
358 Introduction to the Thermodynamics ofMaterials 10.7 CaO and MgO form a simple eutectic system with limited ranges of solid solubility. The eutectic temperature is 2370 C. Assuming that the solutes in the two solid solutions obey Henry s law with in MgO=12.88 and 2300 C, calculate the solutibility of CaO in MgO and the solubility of MgO in CaO at 2300 C. in CaO =6.23 at