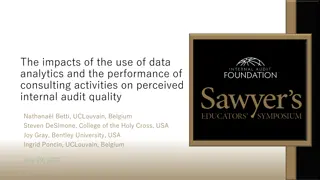
Introduction to Data Analytics Training - High Level Goals and Motivation
Tremendous advances in statistical methods, machine learning, and data mining have opened up new possibilities in analyzing structured and unstructured data. Explore the foundations of data analytics, learn popular tools for analysis, and understand the significance of cloud storage and deployment. Dive into the world of newer data types and discover the top ten largest databases in 2007. Join Rich's Data Analytics Training for a comprehensive learning experience.

Download Presentation

Please find below an Image/Link to download the presentation.
The content on the website is provided AS IS for your information and personal use only. It may not be sold, licensed, or shared on other websites without obtaining consent from the author.If you encounter any issues during the download, it is possible that the publisher has removed the file from their server.
You are allowed to download the files provided on this website for personal or commercial use, subject to the condition that they are used lawfully. All files are the property of their respective owners.
The content on the website is provided AS IS for your information and personal use only. It may not be sold, licensed, or shared on other websites without obtaining consent from the author.
E N D
Presentation Transcript
Introduction to Data Analytics 1 B.RAMAMURTHY 3/8/2025 Rich's Data Analytics Training
High Level Goals for the course 2 Understand foundations of data analytics so that you can interpret and communicate results and make informed decisions Study and learn to apply common statistical methods and machine learning algorithms to solve business problems Learn to work with popular tools to analyze and visualize data; more importantly encourage consistency across departments on analytics/tools used Working with cloud for data storage and for deployment of applications Learn methods for mastering and applying emerging concepts and technologies for continuous data-driven improvements to your business processes Transform complex analytics into routine processes 3/8/2025 Rich's Data Analytics Training
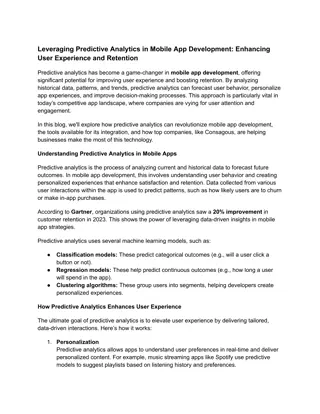
Motivation 3 Tremendous advances have taken place in statistical methods and tools, machine learning and data mining approaches, and internet based dissemination tools for analysis and visualization. Many tools are open source and freely available for anybody to use. Is there an easy entry-point into learning these technologies? Can we make these tools easily accessible to the decision makers similar to how office productivity software is used? 3/8/2025 Rich's Data Analytics Training
Newer kinds of Data 4 New kinds of data from different sources (see p.23 of Data Science book) : tweets, geo location, emails, blogs Two major types: structured and unstructured data Structured data: data collected and stored according to well defined schema; Realtime stock quotes Unstructured data: messages from social media, news, talks, books, letters, manuscripts, court documents.. Regardless of their differences, they work in tandem in any effective big data operation. Companies wishing to make the most of their data should use tools that utilize the benefits of both. 5 We will discuss methods for analyzing both structured and unstructured data 3/8/2025 Rich's Data Analytics Training
Top Ten Largest Databases 7000 6000 5000 Terabytes 4000 Top ten largest databases (2007) 3000 2000 1000 0 LOC CIA Amazon YOUTube ChoicePt Sprint Google AT&T NERSC Climate Ref: http://www.comparebusinessproducts.com/fyi/10-largest-databases-in-the-world/ 5 3/8/2025 Rich's Data Analytics Training
Top Ten Largest Databases in 2007 vs Facebook s cluster in 2010 21 PetaByte In 2010 7000 6000 5000 4000 Terabytes 3000 Top ten largest databases (2007) 2000 1000 0 Facebook LOC CIA Amazon YOUTube ChoicePt Sprint Google AT&T NERSC Climate Ref: http://www.comparebusinessproducts.com/fyi/10-largest-databases-in-the-world 6 3/8/2025 Rich's Data Analytics Training
Data Strategy 7 In this era of big data, what is your data strategy? Strategy as in simple Planning for the data challenge It is not only about big data: all sizes and forms of data Data collections from customers used to be an elaborate task: surveys, and other such instruments Nowadays data is available in abundance: thanks to the technological advances as well as the social networks Data is also generated by many of your own business processes and applications Data strategy means many different things: we will discuss this next 3/8/2025 Rich's Data Analytics Training
Components of a data Strategy1 8 Data integration Meta data Data modeling Organizational roles and responsibilities Performance and metrics Security and privacy Structured data management Unstructured data management Business intelligence Data analysis and visualization Tapping into social data This course will provide training in emerging technologies, tools, environments and APIs available for developing and implementing one or more of these components. 3/8/2025 Rich's Data Analytics Training
Data Strategy for newer kinds of data 9 How will you collect data? Aggregate data? What are your sources? (Eg. Social media) How will you store them? And Where? How will you use the data? Analyze them? Analytics? Data mining? Pattern recognition? How will you present or report the data to the stakeholders and decision makers? visualization? Archive the data for provenance and accountability. 3/8/2025 Rich's Data Analytics Training
Tools for Analytics 10 Elaborate tools with nifty visualizations; expensive licensing fees: Ex: Tableau, Tom Sawyer Software that you can buy for data analytics: Brilig, small, affordable but short-lived Open sources tools: Gephi, sporadic support Open source, freeware with excellent community involvement: R system Some desirable characteristics of the tools: simple, quick to apply, intuitive, useful, flat learning curve A demo to prove this point: data actions /decisions 3/8/2025 Rich's Data Analytics Training
Demo: Exam1 Grade: Traditional reporting 1 Q1 16.7 20.0 20.0 Q2 13.9 16.0 20.0 Q3 9.6 9.0 15.0 Q4 18.5 19.0 25.0 Q5 13.7 17.0 20.0 Total 72.4 76.0 90.0 Q1 16.0 80.1% Q2 14.2 71.1% Q3 9.6 Q4 19.4 77.4% Q5 14.0 70.2% Total 73.2 73.2% 64.0% Q1 17.3 86.7% Q2 13.6 67.8% Q3 9.7 Q4 17.6 70.3% Q5 13.3 66.7% Total 71.5 71.5% 64.6% Question 1..5, total, mean, median, mode; mean ver1, mean ver2 11 3/8/2025 Rich's Data Analytics Training
Traditional approach 2: points vs #students 12 Distribution of exam1 points 3/8/2025 Rich's Data Analytics Training
Individual questions analyzed.. 13 3/8/2025 Rich's Data Analytics Training
Interpretation and action/decisions 14 3/8/2025 Rich's Data Analytics Training
R-code 15 data2<-read.csv(file.choose()) exam1<-data2$midterm hist(exam1, col=rainbow(8)) boxplot(data2, col=rainbow(6)) boxplot(data2,col=c("orange","green","blue","grey","yellow", "sienna")) fn<-boxplot(data2,col=c("orange","green","blue","grey","yellow", "pink"))$stats text(5.55, fn[1,6], paste("Minimum =", fn[1,6]), adj=0, cex=.7) text(5.55, fn[2,6], paste("LQuartile =", fn[2,6]), adj=0, cex=.7) text(5.0, fn[3,6], paste("Median =", fn[3,6]), adj=0, cex=.7) text(5.55, fn[4,6], paste("UQuartile =", fn[4,6]), adj=0, cex=.7) text(5.55, fn[5,6], paste("Maximum =", fn[5,6]), adj=0, cex=.7) grid(nx=NA, ny=NULL) 3/8/2025 Rich's Data Analytics Training
Demo Details 16 Grade data stored in excel file and common input format Converted this file to csv Start a R Studio project Read in the csv data (using a file chooser option) into data2 boxplot(data2) That is it. You can now add legends, colors, and labels to make it presentable. Export the plot as a image or pdf to report the results 3/8/2025 Rich's Data Analytics Training
Format of the course 17 Focus on a single topic per session Begin with general introduction to the topic Related concepts explained Sample problems and solutions, algorithms, methods and hands on exercises Implement solutions using tools Don t hesitate to provide feedback, ask questions What this course is NOT: We will NOT teach Statistics or Machine Learning insides, but we will learn how to apply and use them for data analytics 3/8/2025 Rich's Data Analytics Training
Session Format Slide Presentation Visualization Portfolio Session: lecture, demos, hands-on exercises Lab Handout Projects: R-Project Code/Program Data 18 3/8/2025 Rich's Data Analytics Training
Todays Topic: Exploratory data analysis (EDA) 19 The R Programming language The R project for statistical computing R Studio integrated development environment (IDE) Data analysis with R: charts, plots, maps, packages Also look at the CRAN: Comprehensive R Archive Network Understanding your data Basic statistical analysis Chapter 1 : What is Data Science? Chapter 2: Exploratory Data Analysis and Data Science Process 3/8/2025 Rich's Data Analytics Training
R Language 20 R is a software package for statistical computing. R is an interpreted language It is open source with high level of contribution from the community R is very good at plotting graphics, analyzing data, and fitting statistical models using data that fits in the computer s memory. It s not as good at storing data in complicated structures, efficiently querying data, or working with data that doesn t fit in the computer s memory. 3/8/2025 Rich's Data Analytics Training
R Programming Language3,4 21 R is popular language for statistical analysis of data, visualization and reporting. It is a complete programming language. R is a free software: Gnu General Public Licensing (GPL) R Studio is a powerful IDE for R. R is not a tool for data acquisition/collection/data entry. This is a major point on which it differs from Excel and other data input applications. 3/8/2025 Rich's Data Analytics Training
Why R? 22 There are many packages available for statistical analysis such as SAS and SPSS but they are expensive (user license based) and are proprietary. R is open source and it can pretty much do what SAS can do but free. R is considered one of the best statistical tools in the world. People can submit their own R packages/libraries, using latest cutting edge techniques. To date R has got almost 5,000 packages in the CRAN (Comprehensive R Archive Network The site which maintains the R project) repository. R is great for exploratory data analysis (EDA): for understanding the nature of your data and quickly create useful visualization 3/8/2025 Rich's Data Analytics Training
R Packages 23 An R package is a set of related functions To use a package you need to load it into R R offers a large number of packages for various vertical and horizontal domains: Horizontal: display graphics, statistical packages, machine learning Verticals: wide variety of industries: analyzing stock market data, modeling credit risks, social sciences, automobile data 3/8/2025 Rich's Data Analytics Training
R Packages 24 A package is a collection of functions and data files bundled together. In order to use the components of a package it needs to be installed in the local library of the R environment. Loading packages Custom packages Building packages Activity: explore what R packages are available, if any, for your domain http://cran.r-project.org/web/packages/available_packages_by_name.html Later on, try to create a custom package for your business domain. 3/8/2025 Rich's Data Analytics Training
Library 25 Library Package Class R also provides many data sets for exploring its features 3/8/2025 Rich's Data Analytics Training
Learning R 26 R Basics, fundamentals The R language Working with data Statistics with R language R syntax R Control structures R Objects R formulas Install and use packages Quick overview and tutorial 3/8/2025 Rich's Data Analytics Training
R Studio 27 Lets examine the R studio environment 3/8/2025 Rich's Data Analytics Training
Input Data sources 28 Data for the analytics can be from many different sources: simple .csv file, relational database, xml based web documents, sources on the cloud (dropbox, storage drives). Today we will examine how to input data into R from: csv file and by scraping the web files. This will allow you to input any web data and excel data you have into R for processing and analytics. We will discuss ODBC and cloud sources in a later session. 3/8/2025 Rich's Data Analytics Training
Summary 29 Data analytics is an important component of today s business Analytics is not just for big data, but all sizes and shapes of data (Eg. Maps) Visualization plays important role in presenting the results of analytics Two main approaches for data analytics: statistical modeling and machine learning algorithms R is a powerful open-source tool we will use extensively in this session 3/8/2025 Rich's Data Analytics Training
Review / Questions 30 Make sure you have internet connection as UBGuest Download all the course material from this link: http://www.cse.buffalo.edu/faculty/bina/Richs Questions? 3/8/2025 Rich's Data Analytics Training
Lab 1 31 We will work on the R Studio by following the instructions in the lab handout. Look at a simple examples to get us started. Look at basic commands with variables and vectors as described in the Lab 1 handout. Then we will move on to install packages, access google APIs, upload data from the web, work with csv files of data. On to plots, charts and other visual analytics. 3/8/2025 Rich's Data Analytics Training
Goals 32 Major goal of the lab is to get introduced to the various features of R and Rstudio In this session we will look at the base and core features We will discuss the features in terms of a set of exercises We expect the participants to try these features with data sets you have at work The end product of this lab session is a project file with (i) script of various commands learned (ii) a portfolio of output visuals generated by various plots (iii) data set collected 3/8/2025 Rich's Data Analytics Training
Features of RStudio 33 Regions of RStudio: (i) console, (ii) data, (iii) script, (iv) plots and packages Primary feature: Project is a collection of files: data, graphs, R script: lets create a new project R allows all the basic arithmetic: +, - , variables Vectors: collection of same type of elements; very important data element Creating a vector; changing a vector; factoring a vector x<- c(1,4,9,19) Calling a function: mean (x) Missing data: NA (not available), NULL(absence of anything) z<- c(8, NA, 19) z <- c(8,NULL, 18) znew<-na.omit(z) 3/8/2025 Rich's Data Analytics Training
Features (contd.) 34 Ingesting (reading) data into R Reading csv Reading from the web We will spend some time here to plan your data collection strategy Data included with R Lot of historical data (old data is easy to publicize/declassify) Simple commands to work with data sets summary(data) head(data) 3/8/2025 Rich's Data Analytics Training
References 35 [1] S. Adelman, L. Moss, M. Abai. Data Strategy. Addison-Wesley, 2005. [2] T. Davenport. A Predictive Analytics Primer. Sept2, 2014, Harvard Business Review. http://blogs.hbr.org/2014/09/a-predictive-analytics- primer/ [3] The R project, http://www.r-project.org/ [4] J.P. Lander. R for Everyone: Advanced Analytics and graphics. Addison Wesley. 2014. [5] M. NemSchoff. A quick guide to structured and unstructured data. In Smart Data Collective, June 28, 2014. 3/8/2025 Rich's Data Analytics Training


")


")