Introduction to Dynamic Causal Modelling in Neuroimaging
Explore the world of Dynamic Causal Modelling (DCM) in neuroimaging with Dr. Edda Bilek from Heidelberg University, Germany. Learn about modeling task-related fMRI data, estimating parameters, inferring model evidence, and specifying subject DCM in SPM. Understand structural, functional, and effective connectivity, as well as neural model basics. Engage in practical sessions focusing on analyzing brain activity and investigating lateralization in semantic processing.
Uploaded on | 0 Views
Download Presentation

Please find below an Image/Link to download the presentation.
The content on the website is provided AS IS for your information and personal use only. It may not be sold, licensed, or shared on other websites without obtaining consent from the author. If you encounter any issues during the download, it is possible that the publisher has removed the file from their server.
You are allowed to download the files provided on this website for personal or commercial use, subject to the condition that they are used lawfully. All files are the property of their respective owners.
The content on the website is provided AS IS for your information and personal use only. It may not be sold, licensed, or shared on other websites without obtaining consent from the author.
E N D
Presentation Transcript
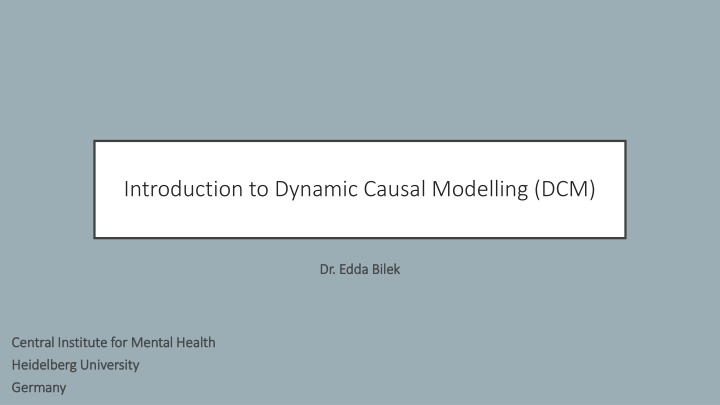
Introduction to Dynamic Causal Modelling (DCM) Dr. Dr.Edda Bilek Edda Bilek Central Institute for Mental Health Central Institute for Mental Health Heidelberg University Heidelberg University Germany Germany
Learning objectives What is dynamic causal modelling (DCM)? How do we model task related fMRI data (forward model)? How are parameters estimated and model evidence inferred Demo & practical sessions! How is a subject DCM specified in SPM?
Structural, functional & effective connectivity structual structual connectivity connectivity functional connectivity functional connectivity effective connectivity effective connectivity Sporns, 2007, Scholarpedia Structural connectivity Structural connectivity Presence of axonal connections / white matter tracks (e.g., DWI) Functional connectivity Functional connectivity Statistical dependencies between regional time series (e.g., ICA) Effective connectivity Effective connectivity Causal (directed) influences between neuronal populations (e.g., DCM; based on explicit network models)
Neural model basics Which regions? Z Which connections in network? ROI1 ROI3 A U = all input (driving, modulating) Where does driving input enter the network? C ROI2 ROI4 Which connections are modulated e.g. by conditions B
Task (for demo and practicals) Subject Subject- -level GLM ( level GLM (analysis analysis of of brain brainactivity activity) ) Factor 1: Semantic (match meaning of the stimulus) vs. perceptual (match similar looking stimulus) Factor 2: simulus pictures vs. words
Task (for demo and practicals) Subject Subject- -level level factors factors Factor 1: Semantic (match meaning of the stimulus) vs. perceptual (match similar looking stimulus) Factor 2: simulus pictures vs. words Group Group- -level level hypothesis hypothesis Hypothesis: In semantic, some people use left/right hemisphere more. What is the underlying connectivity that causes lateralization? Group Group- -level level factor factor Laterlization index (one value for each subject) https://www.fil.ion.ucl.ac.uk/spm/docs/tutorials/dcm/dcm_fmri_first_level/ Seghier et al. (2011)
Task (for demo and practicals) Driving Driving (external) (external) input input Semantic: pictures and words ( task ) Modulators Modulators Task condition pictures Task condition words Group-level (lateralization index) -> Group-level analysis (PEB) https://www.fil.ion.ucl.ac.uk/spm/docs/tutorials/dcm/dcm_fmri_first_level/ Seghier et al. (2011)
Neural model specification U = task, conditions, covariates (subject level) ROI1 ROI3 Z = ROI1, ROI2, ROI3, ROI4 from R1 R2 R3 R4 R1 R2 R3 R4 1 1 1 1 R1 R2 R3 R4 R1 R2 R3 R4 1 1 0 0 1 1 1 1 0 0 1 1 ROI2 ROI4 ? = to 0 0 0 0 0 0 0 0 0 0 0 0 0 0 0 0 1 0 1 1 0 1 0 0 1 1 1 0 0 0 0 1 1 0 1 1 0 1 0 0 1 1 1 0 0 0 0 1 ?1= ?2= ?3= task pic words R1 R2 R3 R4 0 1 0 1 0 0 0 0 0 0 0 0 ? = Zeidman et al., 2019a, Neuroimage
Forward model ?? ? ?? Different forward models depending on the data Enables data simulation Bayesian model inversion, Bayesian model comparison Zeidman et al., 2019a, Neuroimage
Bilinear state equation Neural and non Neural and non- -neural sources neural sources ? = ?(?,?,??) ? = ? ?,? + ?0?0+ ? Neuronal state equation Neuronal state equation ?????? + ?? ? = ? + ?=1 Bilinear state equation Bilinear state equation state state changes changes modulation of modulation of connectivity connectivity system system state state z direct direct inputs inputs m m external external inputs inputs connectivity connectivity j j n z a a b b z c c u 1 11 1 11 1 1 11 1 1 n m m = j = + + u j 1 j j z a a b b c c u 1 1 1 n n nn n nn n n nm m
Parameter estimation Which model (parameters) best explains y? Bayesian inference to quantify uncertainty Priors Priors Connection on: expected = 0, variance 0 Connection off: expected = 0, variance = 0 Model inversion Model inversion Maximize log evidence ln?(?|?) Approximation by negative variational free energy ln? ? ? ? = ???????? ? ? ??????????(?) Probability density over possible parameter values
Bayesian model comparison Overfitting Overfitting construct complex models with excellent or perfect fit, which are mechanistically meaningless and do not generalize Bayesian model selection mandatory Bayes factor Bayes factor log ? ? ? = ???????? ? ??????????(?) ?(?|??) ?(?|??) ???= Bayes Factor Bayes Factor Pitt & Miyung (2002), TICS
Reading Introduction and tutorials Introduction and tutorials K.J. Friston, L. Harrison, and W.D. Penny. Dynamic Causal Modelling. NeuroImage, 19(4):1273 1302, 2003. Tutorial papers (Zeidman et al., 2019ab, Neuroimage) DCM: doi:10.1016/j.neuroimage.2019.06.031 PEB: doi:10.1016/j.neuroimage.2019.06.032 Resources: papers, step-by-step guide, data: https://github.com/pzeidman/dcm-peb- example Other Other https://en.wikibooks.org/wiki/SPM/Parametric_Empirical_Bayes_(PEB)
Thank you Thank you
DCM functions in SPM: Practical example
DCM in SPM Visually presented dots (static, moving; with/out attention) 3 conditions: photic: all conditions with visual input motion: all conditions with moving dots attention: attention-to-motion condition only 3 ROIs: V1: visual stimulation V5: motion (e.g. V5) V5 and superior parietal cortex (SPC)

