Introduction to Geographic Information Systems
A geographic information system (GIS) integrates hardware, software, and data for capturing, managing, analyzing, and displaying geographically referenced information. GIS allows us to view, question, analyze, and visualize data in various ways revealing relationships, patterns, and trends through maps, globes, reports, and charts. Learn about GIS hardware, software options like ArcGIS, MapInfo, and Quantum GIS, as well as the differences between QGIS and ArcGIS. Explore GIS data types such as topographic maps, toponyms, nautical charts, and more.

Download Presentation

Please find below an Image/Link to download the presentation.
The content on the website is provided AS IS for your information and personal use only. It may not be sold, licensed, or shared on other websites without obtaining consent from the author. If you encounter any issues during the download, it is possible that the publisher has removed the file from their server.
You are allowed to download the files provided on this website for personal or commercial use, subject to the condition that they are used lawfully. All files are the property of their respective owners.
The content on the website is provided AS IS for your information and personal use only. It may not be sold, licensed, or shared on other websites without obtaining consent from the author.
E N D
Presentation Transcript
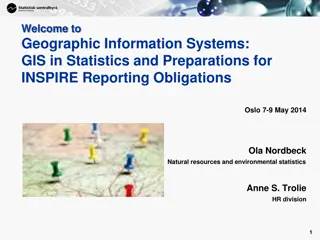
QGIS TRAINING Introduction to GIS
What is a Geographic Information System Definitions A geographic information system (GIS) integrates hardware, software, and data for capturing, managing, analyzing, and displaying all forms of geographically referenced information. GIS allows us to view, understand, question, interpret, and visualize data in many ways that reveal relationships, patterns, and trends in the form of maps, globes, reports, and charts
What is a Geographic Information System Hardware GPS handsets Digitizing tables to digitize topographic maps and charts Plotters and printers Software ArcGIS (ESRI, commercial) MapInfo (Pitner Bowes Software, commercial) Quantum GIS (open source)
What is a Geographic Information System QGIS vs ArcGIS QGIS and ArcGIS desktop have similar features ArcGIS is commercial, well documented and supported QGIS is open source and free, extended with plugins, very active community ArcGIS is usually favoured by large companies such as utilities who can afford licencing and training costs QGIS is favoured by GIS enthusiasts, students, small companies
What is a Geographic Information System Data Topographic maps Toponyms Nautical charts Bathymetric charts Geomorphological classification Aerial and satellite imagery Field data
Topographic maps Generally produced by the Lands and Surveys from topographic surveys and aerial photography Show relief, vegetation, water, buildings and relief features Legacy maps are often in paper form, use diverse projections/datum and are not always readily usable in GIS software.
Toponyms Toponyms are geographic names, gathered from old paper maps and charts or provided by Lands & Surveys GeoNames (http://www.geonames.org) is a global geographic database that provides a geographic index of more than 11 million geographic names (gazetteer) An approximate location is associated to place names A: administrative areas, country, state, region,... H: hydrographic features, bay, channel, stream, lake L: land features, parks,area,... P: populated places, city, village,... R: road, railroad , S: spot, building, farm, T: island, mountain, peak, hill,rock,... U: undersea, trench seamount, shoal, V: forest,coconut grove, bush, Name Alternate names Latitude Longitude Feature Feature code class Eua 'Eua, ai wa dao,e- ua seom, , , -21.3632 -174.93 A H L P S T U ADM1 BAY PRK PPL SCHC ISL SMU Vai utukakau Fa oneluaTropical Garden Tefisi Tonga College Tufaka Island Feinga Seamount -18.5957 -173.926 -21.1371 -175.226 -18.6298 -174.014 -21.1842 -175.226 -21.067 -175.254 -20.15 Ngaakau,Tefisi `Atele, Atele Tufagga -175.15
Toponyms Feature class T: island, mountain, peak, hill, rock, Feature class H: hydrographic features, bay, channel, stream, lake,
Toponyms Feature class P: populated places, city, village
Toponyms Feature class Feature codes
Maritime boundaries Maritime boundaries encompass the Exclusive Economic Zone (EEZ), territorial seas (12 nm), contiguous zones (24 nm), internal waters and archipelagic waters. Latest maritime boundaries can be obtained from http://www.marineregions.org Capricorn Seamount
Nautical charts Nautical charts are produced by the hydrographic offices for navigation purpose It details coastline, soundings, underwater features, navigation aids and hazards Legacy charts are often in paper form, use diverse projections/datum and are not always readily usable in GIS software
Bathymetric charts Bathymetric charts are produced by the hydrographic offices after conducting bathymetric surveys of the seafloor but actual data is scarce. Capricorn Seamount
LiDAR data LiDAR is a surveying method that measures distance to the plane using laser pulses. Bathymetric LiDAR can measure depth up to 50 m by using green lasers. That data is scarce in Pacific countries, and bathymetric LiDAR even rarer. LiDAR derived information can be used as part of habitat mapping (shallow reefs, mangroves) Capricorn Seamount
Satellite imagery Low resolution satellite imagery is generally available for free, while high-resolution imagery must be purchased and licensing usually restrict its distribution Freely available low resolution multi-spectral & radar satellite imagery Landsat 7 ETM+, Landsat 8 : Earth Explorer (http://earthexplorer.usgs.gov) Sentinel-1,2,3 : Copernicus Open Access Hub (https://scihub.copernicus.eu) Ocean monitoring Sea Surface Temperature, Chlorophyll-a (SeaWIFS), MODIS : NOAA/NASA (https://oceancolor.gsfc.nasa.gov) Commercial high-resolution imagery IKONOS, GeoEye, QuickBird, WorldView-1,2,3,4 Pl iades, Capricorn Seamount
Aerial photography Aerial photography has a higher resolution than satellite imagery but requires flying a survey plane above the area. Survey drones (fixed-wings) can also be used for small areas (a few ha) Legacy aerial surveys were using rolls of films, that needed to be scanned and the imagery rectified. Nowadays aerial surveys use multispectral sensors similar to satellites. Capricorn Seamount
What is a Geographic Information System Definitions A geographic information system (GIS) integrates hardware, software, and data for capturing, managing, analyzing, and displaying all forms of geographically referenced information. GIS allows us to view, understand, question, interpret, and visualize data in many ways that reveal relationships, patterns, and trends in the form of maps, globes, reports, and charts (source: www.gis.com)
Layer types Raster Layer A raster layer is an image (scanned picture, satellite image). Common image formats used in GIS are GeoTIFF (*.TIF) ERDAS Compress Wavelets (*.ECW) JPEG 2000 (*.JP2) ESRI HDR (*.BIL) Binary Grid (*.GRD) for bathymetry and elevations Low Res (Landsat 7) High Res (World View 2)
Layer types Vector Layer A vector layer consists in geometrical primitives such as points, lines, polylines and polygons to which can be associated attributes (name, value etc .) Common vector formats used in GIS are ESRI Shapefile (*.SHP) MapInfo TAB (*.TAB) Keyhole Markup Language (*.KML) GPS eXchange Format (*.GPX) Vector layers can be manipulated and zoomed-in to any arbitrary resolution.
Layer types Delimited Text Layer Text file with columns separated by a delimiter (often tab, colon or semicolon) Often used to import field data with GPS position into the GIS. Must contain columns with longitude and latitude in decimal degrees Coordinate reference system is WGS 84 / ESPG:4326
Layer attributes (vector) Data associated with points, lines and polygons
Layer style (vector) Colors, shapes and sizes for the layer
Layer style (raster) Manipulation of the raster image
QGIS Latest version of QGIS can be obtained from https://www.qgis.org


")
")
")